For active investors, the challenge is not typically finding a good stock or an entry point; it’s knowing where to get out. When a stock surges past its previous high, you enter what technical analysts call “uncharted territory.” Without historical price action to guide your profit taking, how do you set an objective target that is neither too greedy nor too conservative?
The answer lies in the predictive power of Fibonacci Extensions.

If you’ve used Fibonacci Retracements to find potential entry points during a market pullback, the Extension tool is the logical next step: it is your Price Navigator, designed to project future price targets in the direction of the trend. Based on the same universal mathematical principles as their retracement cousins, Fibonacci Extension levels provide objective, data driven zones where a strong trend is likely to pause, consolidate, or reverse, making them the perfect tool for defining your profit targets stock analysis.
This definitive step by step guide to Fibonacci Extensions will walk you through the core mathematics, the crucial three point drawing method, and a practical strategy for using these powerful levels to manage risk and lock in gains.
The Core Concept: Extensions vs Retracements
The first step to mastering the extension tool is understanding its purpose and how it differs from the more common Fibonacci Retracement tool. Both are rooted in the natural ratios derived from the Fibonacci number sequence, but they serve opposite functions:
- Fibonacci Retracements (Entry Tool): Measure within the initial price move. They are used to find potential support (pullback) levels before the price resumes the trend. The key levels are below 100% (e.g., $38.2%, 61.8%).
- Fibonacci Extensions (Exit Tool): Measure beyond the initial price move. They are used to project Fibonacci Extension levels (profit targets) after the price has completed its pullback and resumed the trend. The key levels are above 100% (e.g., 127.2%, 161.8%).
Essentially, retracements help you plan your entry on a “dip,” and extensions help you plan your exit on the subsequent “run.”
The Ultimate Time Saver: Analyze Any Chart in 1 Click 📊⏱️
You understand the complexity involved in manually cross-referencing trends, RSI, MACD, and volume. You even understand the top stock chart patterns and how to interpret their bullish or bearish meanings. But the financial markets move so fast that every minute spent manually analyzing a chart is an opportunity lost.
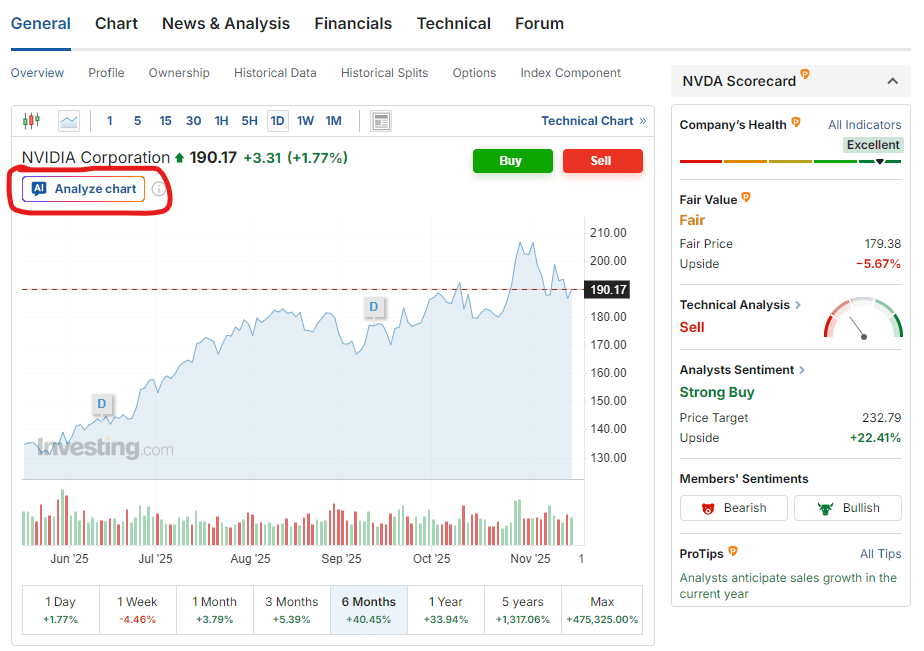
Investing.com’s exclusive WarrenAI tool cuts through the noise. Simply navigate to any stock, crypto, or commodity page on Investing.com and click ‘Analyze Chart’ button (as shown below).
The Golden Ratio φ: The Mathematical Foundation
The core of all Fibonacci analysis is the golden ratio in trading, represented by the Greek letter φ (Phi), which is approximately 1.618. The key extension levels are all derived from this ratio, either directly or through related mathematical relationships:
- 161.8% (1.618): The primary Golden Ratio level, often the strongest resistance/support target.
- 261.8% (2.618): Derived by multiplying the golden ratio by itself (1.618 * 1.618 approximately equal to 2.618), representing a highly extended or parabolic move.
- 127.2%: The square root of the golden ratio’s reciprocal (sqrt {1/0.618} \approx 1.272$). This is often a conservative, high probability target.
- 200% (2.0): Not a pure Fibonacci ratio, but it represents a 1:1 projected move (the price travels a distance equal to the initial move, A to B). This psychological level is widely watched by institutions.
Mastering the Three Point Drawing Method (A B C)
The accuracy of your profit targets hinges entirely on correctly applying the A B C trading strategy to your chart. Unlike retracements, which require two points, extensions require three distinct price anchors:
Point A and B: Defining the Impulse Move
- Point A (Start): The start of the initial, significant price move (the Swing Low in an uptrend, or Swing High in a downtrend).
- Point B (End): The end of the initial, significant price move (the Swing High in an uptrend, or Swing Low in a downtrend).
These two points define the length of the base move to which the extension ratios will be applied. It is crucial to select clear, significant swing points on your chosen timeframe (e.g., the daily chart for swing trading).
Point C: Identifying the Retracement Anchor
- Point C (Retracement): The end of the pullback or correction that followed Point B. This is the low of the pullback in an uptrend, or the high of the rally in a downtrend.
The Fibonacci Extension tool calculates the extension levels by taking the length of the A to B move and projecting the Fibonacci ratios from Point C.
Visual Reference: Imagine you are stretching a rubber band from A to B. You then anchor that rubber band at C. The extension levels are the future price points where the rubber band lands as it is pulled beyond B.
Your Strategy for Using Fibonacci Extension Levels
Once you have identified your A, B, and C points and applied the extension tool, the levels will appear on your chart, providing a clear map for your exit strategy.
Target 1: The 127.2% and 161.8% Zones
These are the most common and often the highest probability profit taking zones.
- The 127.2% Level (The High Probability Target): This is your most conservative, high probability first profit target. Traders often use this level to take partial profits, move their stop loss to the break even point (Point C), or begin trailing their stop loss. This locks in initial gains and secures the trade.
- The 161.8% Level (The Golden Target): This is considered the market’s “proportional expectation. If the trend is healthy, this is the most common full target zone. If price reaches this level, it signals a very strong continuation from the pullback. Many algorithmic and institutional traders target this level, making it a powerful area of resistance (or support in a downtrend).
Unique Angle: The Retracement Depth Rule: The depth of the Point C retracement can offer clues about which target is more likely. A shallow retracement (e.g., to the 38.2% retracement level) suggests a very strong trend, making the $161.8\%$ or $200\%$ extension a higher probability target.
A deep retracement (e.g., to the 78.6% retracement level) suggests a weaker trend, making the 127.2% a safer, more realistic target.
Target 2: The 200% and 261.8% Extended Moves
These levels are reserved for the strongest trends and momentum moves.
- The 200% Level (The Equal Move Target): This level signals that the subsequent move (from C) is twice the size of the initial move (A to B) if C retraced to the 0% level, or a 1:1 projection from C. This level is highly psychological and is a strong magnet in parabolic rallies.
- The 261.8% Level (The Extended Blow Off Target): This is the extreme target, typically hit only in highly impulsive or parabolic markets. It often marks a point of trend exhaustion, a “blow off top,” or an area where price has significantly overshot the average expectation. This level is ideal for taking final profits or reversing the trade.
Trade Management and Confluence: Reducing Risk
Fibonacci Extensions are powerful, but they are prediction zones, not guarantees. The market is not beholden to mathematics alone. To reduce risk and improve accuracy, you must integrate them with other tools.
Confluence: The Power of Alignment
Never use any Fibonacci tool in isolation. Look for confluence where a Fibonacci Extension level aligns with one or more of the following:
- Prior Support or Resistance: If the 161.8% extension level aligns exactly with a previous significant high or low from the distant past, the signal is exponentially stronger.
- Moving Averages: If the stock is trending above its 50 or 200 day Moving Average, and the 127.2% level hits the price of the moving average, it forms a high probability reversal zone.
- Round Numbers: Psychological round numbers (e.g., $100, $500, $1000) are powerful. An extension level that aligns with a major round number is highly reliable.
The Strategy of Scaling Out
To maximize profit while intelligently managing the trade, consider the strategy of scaling out (selling portions of your position) at successive extension levels:
- Entry (Point C): Set stop loss just below Point C (or above C in a downtrend).
- Target 1 (127.2%): Sell 25% of the position, and immediately move the stop loss on the remaining position to the break even point (Point C).
- Target 2 (161.8%): Sell another 50% of the position, and move the stop loss on the remaining $25\%$ to just below the 127.2% level.
- Target 3 (261.8%): Sell the final 25%.
This systematic approach locks in guaranteed profits, secures your initial capital, and allows you to participate in a strong trend without risking all your gains on an overextended move.
Conclusion
Fibonacci Extensions remove the guesswork from setting profit targets. By meticulously applying the three point (A B C) drawing method, you transform vague aspiration into an objective, rules based trading strategy. You move from simply hoping for a strong trend to knowing precisely where the market is mathematically likely to pause, and where you should be locking in gains.
Remember the key takeaways: Extensions are for exits, not entries. They work best in strong, trending markets. Always use them in confluence with other indicators, and always, always employ a scaling out strategy to protect your hard earned profits. Start practicing this technique on your favorite stock chart today.
By making Fibonacci Extension levels a core part of your profit targets stock analysis, you’ll take a major step toward becoming a more disciplined and profitable investor.
Institutional-Grade Analysis, Immediate Results 🔎⏱️
The market moves fast, so make sure your insights move faster. Access WarrenAI’s instant technical analysis alongside the full suite of InvestingPro tools, including proprietary fair value calculations, financial health scores and AI-powered ProPicks.
Unlike other AIs that only analyze numbers, WarrenAI identifies visual patterns (candlestick formations, support levels, and trends) that make or break trades.
What WarrenAI Does Instantly: 🤖
🔎 Technical Summary: Provides a plain-language analysis of the current market structure, including trend, momentum, and key S/R levels.
⚠️ Risk Identification: Points out potential downside risks or failed signals the chart is flashing.
💡 Opportunity Spotlight: Highlights confirmed buy/sell signals based on institutional-grade algorithms, giving you a definitive edge.
🗺️ Trading Plan: Receive specific entry, stop-loss, and profit target prices based on technical analysis and risk/reward calculations that spot opportunities humans often miss.
Stop wasting time doing everything manually. Leverage WarrenAI to gain an instant edge to trade any market – across crypto, forex, commodities, stocks, ETFs and indices. Capture opportunities wherever they emerge, filtering hours of analysis into a concise, actionable report. Don’t get left behind. Start your InvestingPro membership today.