For many investors and traders, looking at a stock chart means navigating a confusing array of lines, squiggles, and colorful technical indicators like the RSI, MACD, or Stochastic Oscillator. These tools, while popular, often create more confusion than clarity, generating signals that are often late and contradictory. Have you ever felt like you were looking at the right information but still missing the bigger picture?
Welcome to the world of Price Action Trading. Price action is the purest form of market analysis. It strips away the clutter and focuses on the unadulterated movement of a security’s price over time. It is the core philosophy that all technical analysis is built upon.
This beginner’s guide to price action trading will serve as your roadmap, teaching you how to read the language of the market directly from your stock charts. We will move step by step, from understanding the foundational charts to executing a complete, low risk trade setup, all based on the simple truth of supply and demand visible in the price itself.
Our goal is to equip you with a clean, powerful, and universally applicable trading strategy that works across all markets and timeframes.
What is Price Action Trading?
Before we dive into the practical application, we must first establish the philosophical foundation of this strategy. What exactly are you looking for when you analyze price action?
The Ultimate Time Saver: Analyze Any Chart in 1 Click 📊⏱️
You understand the complexity involved in manually cross-referencing trends, RSI, MACD, and volume. You even understand the top stock chart patterns and how to interpret their bullish or bearish meanings. But the financial markets move so fast that every minute spent manually analyzing a chart is an opportunity lost.
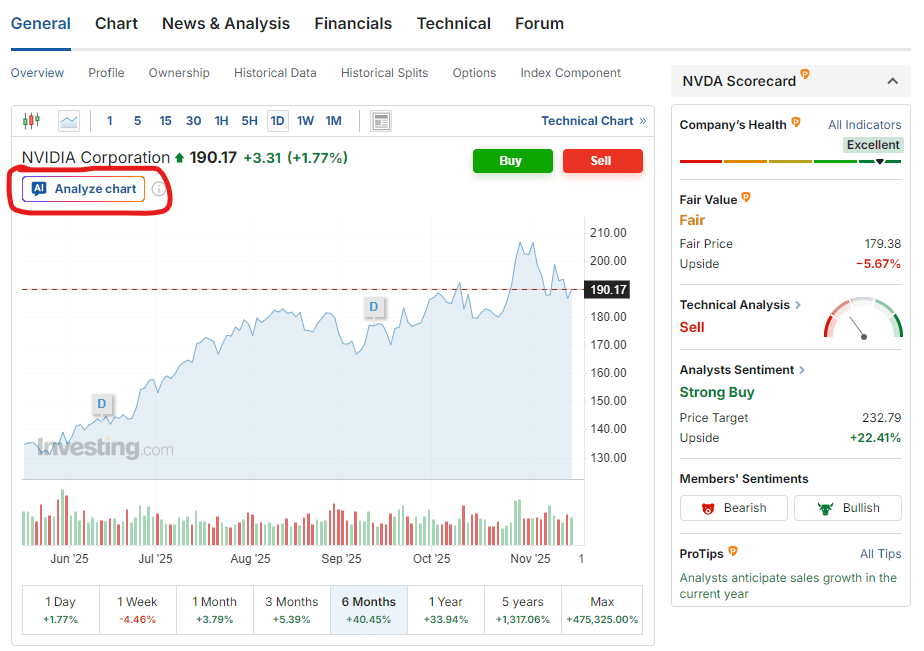
Investing.com’s exclusive WarrenAI tool cuts through the noise. Simply navigate to any stock, crypto, or commodity page on Investing.com and click ‘Analyze Chart’ button (as shown below).
Price Action Defined: The ‘Territory’ Not the ‘Map’
Price Action is the historical record of a security’s price movement. It is the direct result of every decision made by millions of traders, reflecting the collective fear, greed, and consensus of the market. It shows you exactly what the market did, what it is currently doing, and where buyers and sellers drew lines in the sand.
Most traditional indicators, however, are derived from the price action data itself. They take the raw price, apply a mathematical formula, and plot a separate line. Because they are based on past prices, they can only show you a delayed, or “lagging,” interpretation of events.
A moving average, for instance, tells you the average of the last 50 closing prices—a historical view that reacts to events only after they have occurred. Price action, on the other hand, is the immediate, real time truth. Learning to trust the territory over the map is the first and most crucial step in this strategy.
The Shift to Clean Chart Trading
The focus on raw price leads directly to the concept of clean chart trading. A clean chart is one that has zero to minimal indicators. It allows the trader to focus entirely on the two dimensions that matter most: price and time.
Why make this shift? Price action is driven by human emotion and memory. When traders see a price level where a major reversal happened before, they remember it and are likely to act again at that same level. This memory is instantly visible on the chart.
By removing the clutter of indicators, you free yourself from analyzing a derivative of the market’s emotion and instead analyze the emotion itself. This simplification is the problem solver for the overwhelmed beginner, providing a direct, non confusing approach to how to read stock charts.
The Language of Price Action: Candlestick Charts
The primary tool for a price action trader is the candlestick chart. While line charts simply connect closing prices and bar charts show the range, the candlestick chart tells a complete, four point story about the battle between buyers (bulls) and sellers (bears) within a specific timeframe.
Anatomy of a Candlestick: Body and Wicks
A single candlestick provides four critical pieces of data:
- Open: The price at the start of the period.
- Close: The price at the end of the period.
- High: The highest price traded during the period (the top of the upper wick).
- Low: The lowest price traded during the period (the bottom of the lower wick).
The body (the thick central part) represents the opening and closing price. A green or hollow body indicates the price closed higher than it opened (bullish), while a red or filled body indicates it closed lower (bearish).
The thin lines, called wicks or shadows, show the extremes of the price action. Long wicks, for example, reveal that a price area was aggressively rejected by the market.
Three Foundational Candlestick Patterns
Over 100 different candlestick patterns exist, but trying to learn them all is a recipe for analysis paralysis. As a beginner, focus on the Rule of Three: the most powerful, high probability patterns that communicate clear market intent. These candlestick patterns for beginners will form the basis of your trade signals.
The Pin Bar (or Hammer/Shooting Star):
- Structure: A small body with a very long wick on one side and a negligible wick on the other.
- Signal: It represents a sharp rejection of a price level. The long wick shows that the price tried to move in one direction but was forcefully pushed back, often signaling an impending reversal.
The Engulfing Pattern:
- Structure: A two candlestick pattern where the second candlestick’s body completely “engulfs” the body of the previous candlestick.
- Signal: A strong confirmation of momentum. A Bullish Engulfing pattern means buyers completely dominated the sellers from the previous period, often signaling a continuation or a major reversal.
The Inside Bar:
- Structure: A two candlestick pattern where the second candlestick (the ‘inside’ bar) is completely contained within the high to low range of the first candlestick (the ‘mother’ bar).
- Signal: This signifies market consolidation and indecision. Traders look to trade the breakout (a move above the high or below the low of the mother bar) once the consolidation ends, signaling the next momentum swing.
Mapping the Market: Support and Resistance
Candlestick patterns are the signal, but they are meaningless without the proper context. The context is provided by Support and Resistance (S&R) levels, which are the psychological battlegrounds of the market.
Identifying Key Price Levels
Support is a price level where buying interest is strong enough to overcome selling pressure, causing the price to turn higher. Think of it as the floor. Resistance is a price level where selling interest overcomes buying pressure, causing the price to turn lower. Think of it as the ceiling.
These are not thin lines, but rather zones of price memory. When identifying them, look for areas on the chart where the price has touched, paused, or reversed multiple times. The more times a level has been tested and held, and the higher the trading volume at those levels, the more significant that support and resistance trading zone is.
How to Trade Bounces and Breakouts at Key Levels
Combining our signal (candlestick patterns) with our context (S&R levels) creates a high probability trade setup.
- The Bounce Trade (Reversal): Wait for the price to touch a significant Support or Resistance level. A Pin Bar or Engulfing Pattern at that level, indicating a rejection of the price zone, is your cue to enter in the opposite direction.
- The Breakout Trade (Continuation): If the price breaches a strong S&R level with a large, strong bodied candlestick (especially with high volume), it signals that one side of the market has won the battle and a continuation is likely. You would enter in the direction of the break, after a small retest of the broken level.
Trading with Context: Trend is Your Friend
No price action signal should ever be taken in isolation. The most successful trades occur when a signal aligns with the prevailing market trend. Trying to trade against a strong trend is like trying to stop a freight train—you might succeed for a moment, but the risk is monumental.
Defining Trends: Higher Highs and Lower Lows
Reading the trend requires only your eyes and two simple concepts:
- Uptrend (Bullish): Characterized by a sequence of Higher Highs (HH) and Higher Lows (HL). Each peak in price is higher than the last, and each pullback (low) is also higher than the previous pullback.
- Downtrend (Bearish): Characterized by a sequence of Lower Highs (LH) and Lower Lows (LL). Each peak is lower than the last, and each trough is also lower than the previous trough.
Your goal as a price action trader is to identify a reliable signal (e.g., a Pin Bar) at a critical price level (e.g., a Support zone) that also happens to be in the direction of the larger trend. A bullish Pin Bar at a Higher Low in an Uptrend is a high conviction trade.
Using Volume to Confirm Price Moves
While price action is designed to eliminate lagging indicators, volume is an exception. Volume, or the total number of shares traded, provides the conviction behind the move.
- Confirmation: A large price move (a long candlestick) on high volume confirms that the move has strong market participation and is likely to continue.
- Warning: A large price move on low volume is a warning sign that the move is not backed by strong conviction and may easily reverse.
Always look for the volume bar at the bottom of the chart to validate the strength of a pattern or a breakout.
A strong candle is meaningless without conviction. Low-volume breakouts are traps!
InvestingPro offers real-time, professional-grade volume data, alongside more than a thousand other filters on its advanced stock screener. Use it to validate if a Pin Bar rejection or a major breakout is backed by institutional participation and a whole host of other value metrics.
Understand what’s happening beneath the daily price and trade with conviction… not guesswork.
The Price Action Strategy Framework: Entry Exit and Risk
A trading strategy is incomplete without a clear, risk controlled plan. This is where professional money management is integrated directly into your price action analysis.
Placing a Stop Loss Based on Price Structure
The most common mistake beginners make is placing an arbitrary stop loss (e.g., $0.50 below entry). In price action, your stop loss should be placed based on the underlying market structure to prevent being stopped out by random market noise.
The Structural Stop Loss Rule: Your stop loss must be placed at a logical level where, if the price reached it, your original trade idea would be invalidated.
For example, if you enter a long trade (buying) based on a bullish Pin Bar at a Support level:
- The lowest price of that Pin Bar, where sellers were aggressively rejected, is your immediate reference.
- Your stop loss should be placed a small, fixed distance (e.g., 5 to 10 cents) below the lowest point (the wick) of the Pin Bar.
- If the price breaches that wick and closes below it, the original rejection signal has failed, and it is time to exit the trade to protect your capital.
This strategy ensures you only take a risk that the market has structurally defined.
Setting Realistic Profit Targets
Your exit strategy should align with the risk you are taking. The most professional way to do this is to target a Risk Reward Ratio of at least $2 in potential profit for every $1 you risk (a 1:2 ratio).
Once you’ve determined your risk (the distance from your entry to your structural stop loss), your first profit target should be the next major Resistance level on the chart. If the distance to that Resistance level is greater than twice your risk, you have a high quality, low risk trade setup.
- Risk Management Check: Always ensure your potential loss is manageable and your potential profit is attractive. Price action gives you the exact structural reference points for this crucial calculation.
Conclusion
Price action trading is not a mystical art; it is a discipline. It is the practice of reading the pure language of supply and demand, fear and greed, directly from your stock charts without the distortion of complex indicators.
By mastering the fundamental building blocks—candlestick patterns, key Support and Resistance zones, and the context of the larger trend—you can transition from a passive investor to a confident, analytical trader.
The journey begins with simplifying your charts and your mind. Strip away the clutter, learn the Rule of Three candlestick patterns, and begin identifying the crucial battlegrounds of Support and Resistance. Most importantly, anchor every single trade to a structural stop loss, making risk management the first step of your strategy, not an afterthought. The market’s story is written in the price itself—all you have to do is learn to read it.
To put this guide into practice, we encourage you to start by paper trading. Review your favorite stock charts, identify the three key patterns, mark your S&R zones, and practice placing structural stop loss and profit targets before you ever commit real capital.
Institutional-Grade Analysis, Immediate Results 🔎⏱️
The market moves fast, so make sure your insights move faster. Access WarrenAI’s instant technical analysis alongside the full suite of InvestingPro tools, including proprietary fair value calculations, financial health scores and AI-powered ProPicks.
Unlike other AIs that only analyze numbers, WarrenAI identifies visual patterns (candlestick formations, support levels, and trends) that make or break trades.
What WarrenAI Does Instantly: 🤖
🔎 Technical Summary: Provides a plain-language analysis of the current market structure, including trend, momentum, and key S/R levels.
⚠️ Risk Identification: Points out potential downside risks or failed signals the chart is flashing.
💡 Opportunity Spotlight: Highlights confirmed buy/sell signals based on institutional-grade algorithms, giving you a definitive edge.
🗺️ Trading Plan: Receive specific entry, stop-loss, and profit target prices based on technical analysis and risk/reward calculations that spot opportunities humans often miss.
Stop wasting time doing everything manually. Leverage WarrenAI to gain an instant edge to trade any market – across crypto, forex, commodities, stocks, ETFs and indices. Capture opportunities wherever they emerge, filtering hours of analysis into a concise, actionable report.
Don’t get left behind. Start your InvestingPro membership today.