


What is Total Liabilities / Total Assets?
The Total Liabilities / Total Assets ratio is a financial metric that measures the proportion of a company’s assets financed by liabilities. It provides insights into a company’s leverage and financial stability. This ratio is essential for assessing risk, as excessive liabilities can pose challenges in adverse economic conditions, potentially leading to financial distress.
How to Calculate Total Liabilities / Total Assets?
The formula to calculate this ratio is straightforward:

Total Liabilities-to-Total Assets Ratio = Total Liabilities / Total Assets
In this formula,
- Total Liabilities: Includes all short-term and long-term obligations, such as loans, accounts payable, and bonds.
- Total Assets: Represents the sum of all current and non-current assets, such as cash, inventory, property, and investments.
The ratio is expressed as a percentage or a decimal.

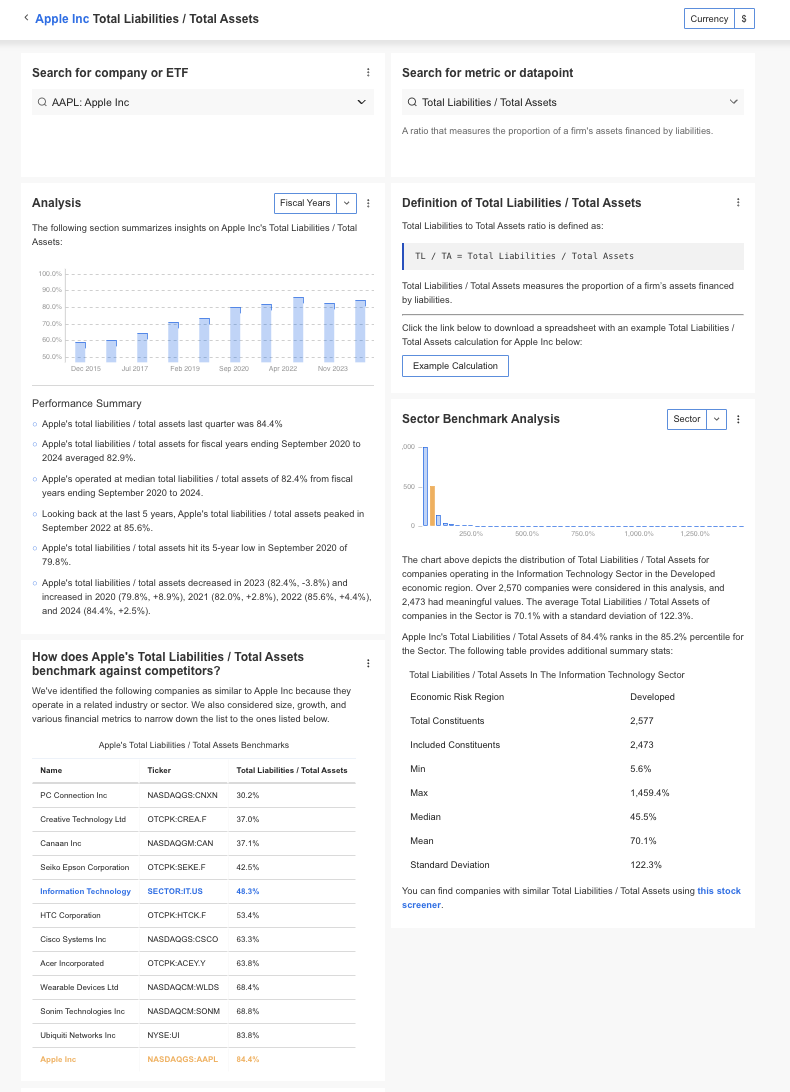
Example Calculation of Total Liabilities / Total Assets
Consider a Company XYZ has the following financial data:
- Total Liabilities: $500,000
- Total Assets: $1,250,000
Using the formula:
Total Liabilities / Total Assets Ratio = 500,000 / 1,250,000
Total Liabilities-to-Total Assets Ratio = 0.4 or 40%
Company XYZ’s ratio of 40% indicates that 40% of its assets are financed through liabilities, while the remaining 60% is funded by equity.
Why is Total Liabilities / Total Assets Important?
The Total Liabilities / Total Assets ratio is a vital financial metric that provides critical insights into a company’s financial health and stability. It serves as a key indicator of how a company finances its operations and the level of financial risk it undertakes.
For businesses, maintaining an optimal ratio is vital to ensuring long-term sustainability. For investors and lenders, it is an indispensable tool for making informed decisions about lending, investment, and partnership opportunities.
Below are the primary reasons why this ratio holds importance for various stakeholders.
Assessing Financial Leverage
The ratio reveals how much of the company’s assets are financed by debt versus equity. High leverage can amplify returns during good times but increases risk during downturns.
Evaluating Financial Stability
By showing the proportion of liabilities to total assets, this ratio helps assess a company’s financial stability. A lower ratio suggests that the company has a solid equity base, which can act as a cushion during adverse financial conditions.
Companies with low ratios are better positioned to weather economic turbulence and are less likely to face liquidity crises.
Creditworthiness Assessment
Lenders and investors often review this ratio to gauge a company’s ability to repay its obligations, thereby assessing its investment potential.
- For Lenders: A lower ratio implies a company has a lower debt burden and is more likely to repay loans on time.
- For Investors: It signals whether the company has excessive liabilities that could jeopardize its profitability and growth potential.
Industry Comparisons
Comparing this ratio within an industry helps identify whether a company is over-leveraged or conservative relative to its peers. For example, if a company’s ratio is significantly higher than the industry average, it may indicate inefficient financial management or excessive risk-taking.
How to Interpret Total Liabilities / Total Assets?
High Ratio
A high Total Liabilities / Total Assets ratio signifies that a significant portion of the company’s assets is financed by liabilities. This can have both positive and negative implications:
Positive Implications:
- Indicates aggressive growth strategies supported by borrowing.
- May be acceptable in industries with stable cash flows, such as utilities or real estate.
Negative Implications:
- Suggests higher financial risk, as the company may struggle to meet debt obligations during economic downturns or periods of declining revenue.
- Indicates potential vulnerability to rising interest rates, which could increase the cost of borrowing.
Moderate Ratio
A moderate ratio, typically between 50% and 70%, reflects a balanced approach to financing assets.
- Indicates prudent financial management with a mix of debt and equity funding.
- Suggests the company has sufficient flexibility to manage obligations while pursuing growth opportunities.
Low Ratio
A low Total Liabilities / Total Assets ratio signifies that most of the company’s assets are financed through equity.
Positive Implications:
- Indicates strong financial stability and a conservative approach to borrowing.
- Reduces financial risk, making the company more attractive to investors and creditors.
Negative Implications:
- May signal underutilization of leverage, potentially limiting growth opportunities.
- Could indicate overly cautious financial management that may not capitalize on opportunities requiring external funding.
What is a Good Total Liabilities / Total Assets?
A “good” ratio varies depending on the industry, company size, and economic conditions. As a general guideline:
- Low Ratio (<50%): Indicates low leverage and strong equity funding, often considered safe.
- Moderate Ratio (50%-70%): Reflects balanced financing, common in stable industries.
- High Ratio (>70%): Suggests high leverage, potentially risky, but acceptable in industries with stable cash flows.
It’s important to evaluate the ratio alongside other financial metrics for a comprehensive assessment.
What are the Limitations of Total Liabilities / Total Assets?
While the total liabilities-to-total assets ratio is a key financial metric, it has its own set of limitations that are essential to know in order to make sound financial decisions. They include:
- Simplistic Measure: The ratio doesn’t differentiate between short-term and long-term liabilities, which can affect financial stability differently.
- Industry Variances: Optimal ratios differ by industry. For example, capital-intensive industries like utilities often have higher ratios than tech companies.
- No Insight into Profitability: The ratio focuses on financial structure but doesn’t reveal whether the company is generating enough revenue to service its liabilities.
- Static Snapshot: It represents a single point in time and doesn’t account for trends or changes in financial health.
- Limited Context Without Benchmarks: The ratio alone is not meaningful without comparisons to industry standards or historical data.
How to Find Total Liabilities / Total Assets?
InvestingPro offers detailed insights into companies’ Total Liabilities / Total Assets including sector benchmarks and competitor analysis.
InvestingPro+: Access Total Liabilities / Total Assets Data Instantly
Unlock Premium Data With InvestingPro 📈💸
Gain instant access to Total Liabilities / Total Assets data within the InvestingPro platform
🛠 Access to 1200+ additional fundamental metrics
🔍 Competitor comparison tools
📊 Evaluate stocks with 14+ proven financial models
Total Liabilities / Total Assets FAQ
Is a high Total Liabilities / Total Assets ratio bad?
Not always. While a high ratio indicates more debt, it can be acceptable in industries with predictable cash flows or during periods of growth.
How does this ratio differ from the debt-to-equity ratio?
The debt-to-equity ratio compares liabilities to equity, while Total Liabilities / Total Assets measures liabilities as a proportion of total assets.
What is a healthy ratio for small businesses?
Small businesses often aim for a ratio below 50%, reflecting prudent financial management.
How often should this ratio be monitored?
It should be reviewed quarterly or annually, depending on the company’s reporting cycle and financial needs.
Can this ratio predict bankruptcy?
While it highlights financial risk, it should be used with other metrics like interest coverage ratio or cash flow analysis to predict bankruptcy.


