


What Is Net Debt?
Net Debt is a financial metric that gives investors and analysts a clearer picture of a company’s overall debt situation by subtracting its cash and cash equivalents from its total debt. This figure helps to assess a company’s ability to repay its debts and provides insight into its financial health.
How to Calculate Net Debt

The formula to calculate Net Debt is straightforward:
Net Debt = Total Debt − Cash and Cash Equivalents
Where:
- Total Debt includes all short-term and long-term liabilities, while
- Cash and Cash Equivalents encompass cash on hand, marketable securities, and other liquid assets.
In this formula, Total Debt comprises short-term as well as long-term debts.
- Short-term debts are financial obligations that must be settled within a year. Examples include short-term bank loans and commercial paper.
- Long-term debts are financial obligations that extend beyond a 12-month period and include bonds, lease obligations, notes payable, and convertible bonds.

Example Calculation of Net Debt
Let’s consider company X’s financial snapshot from its recent annual report. The company reports short-term debt comprising a $15,000 bank loan and $20,000 in commercial paper. For long-term liabilities, it holds $100,000 in bonds and $80,000 in lease obligations. On the asset side, Company X lists $25,000 in cash, $15,000 in short-term investments, and $30,000 in marketable securities.
To determine the net debt of Company X:
- Short-term debt: $15,000 + $20,000 = $35,000
- Long-term debt: $100,000 + $80,000 = $180,000
- Cash and cash equivalents: $25,000 + $15,000 + $30,000 = $70,000
Net Debt Calculation:
Total Debt = Short-term debt + Long-term debt = $35,000 + $180,000 = $215,000
Total Cash and Equivalents = $70,000
Net Debt = Total Debt – Total Cash and Equivalents
Net Debt = $215,000 – $70,000 = $145,000
Therefore, Company X’s net debt amounts to $145,000, indicating its financial position after accounting for its debt obligations and liquid assets.
Why is Net Debt Important?
Net Debt is crucial for evaluating a company’s leverage and financial stability. It provides a more comprehensive view of a company’s debt by factoring in liquid assets, helping investors gauge financial stability.
Investors use Net Debt to evaluate a company’s financial health and risk profile, in addition to its ability to manage debt, influencing decisions on buying, holding, or selling stock. It is a vital metric in corporate finance, providing insights into a company’s leverage and liquidity.
Net debt indicates the amount of cash remaining if all debts were settled, revealing whether a company has sufficient liquidity to meet its debt obligations.
How to Interpret Net Debt
A high Net Debt indicates that a company has significant debt compared to its liquid assets, which could be risky if cash flow problems arise. Conversely, a low or negative Net Debt suggests that the company has enough liquid assets (cash and cash equivalents) to cover its debt obligations, signaling strong financial health.
A negative net debt signifies that a company holds more cash than debt, whereas a positive net debt indicates that its debt outweighs its liquid assets. Given that many companies carry more debt than cash, investors typically benchmark a company’s net debt against others in its industry for context.
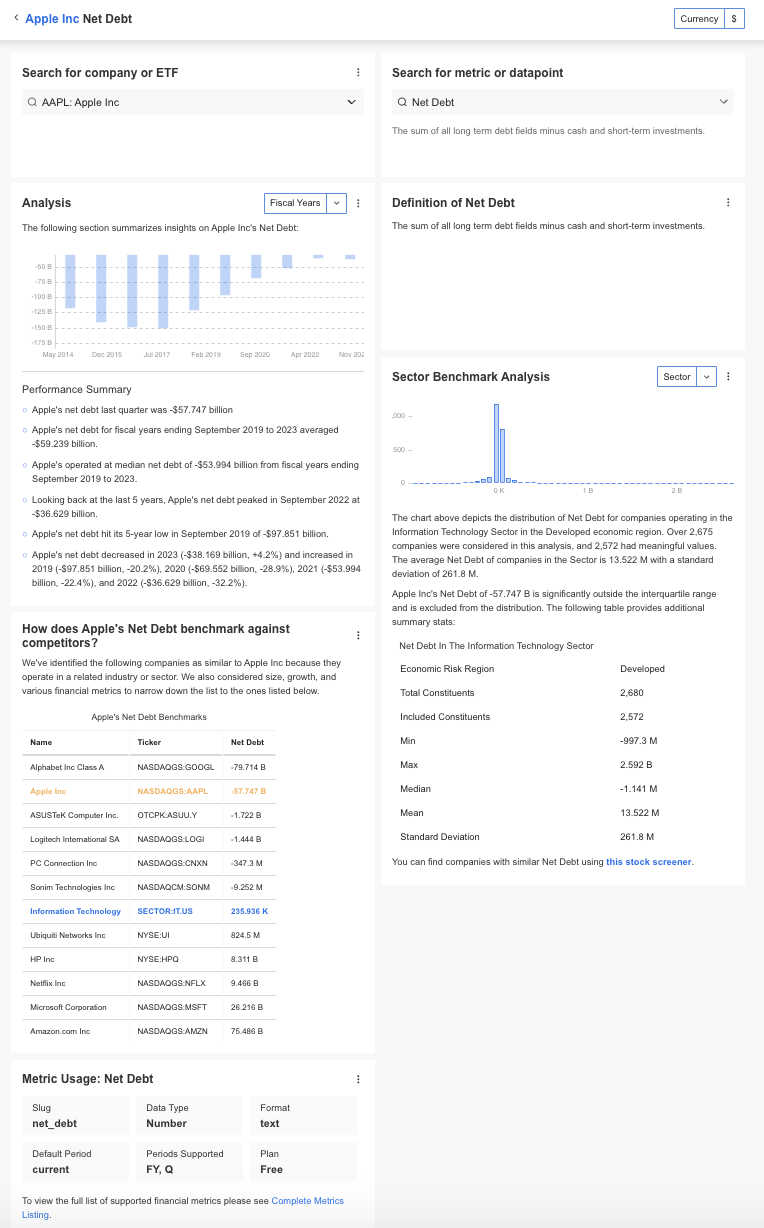
How to Find Net Debt
InvestingPro offers detailed insights into companies’ Net Debt including sector benchmarks and competitor analysis.
Net Debt: FAQ
Q. Why is Net Debt important for investors?
Net Debt offers a clearer picture of a company’s debt situation by considering liquid assets, aiding in the assessment of financial stability and risk.
Q. How does Net Debt differ from total debt?
Unlike total debt, Net Debt subtracts cash and cash equivalents, providing a net figure that reflects actual debt burden.
Q. What does a negative Net Debt indicate?
A negative Net Debt indicates that a company has more cash and liquid assets than its total debt, suggesting strong financial health.
Q. How can Net Debt affect a company’s credit rating?
High Net Debt can lead to a lower credit rating due to perceived higher risk, while low or negative Net Debt can improve creditworthiness.
Q. Is Net Debt used in all industries?
Yes, Net Debt is a versatile metric used across various industries to assess financial leverage and liquidity.
Q. How does Net Debt impact investment decisions?
Investors use Net Debt to evaluate a company’s risk and its ability to manage debt, influencing decisions on buying, holding, or selling stock.


