The stock market is a turbulent sea of constantly shifting prices, driven by news, sentiment, and volume. For new traders, the daily fluctuations can feel like a cacophony of noise, making it nearly impossible to discern the true path of a stock. How can a trader filter out this chaos and gain a clear view of the underlying trend? The answer lies with one of the oldest and most trusted tools in technical analysis: the Moving Average (MA).
A Moving Average is essentially a price compass that smooths out price data by creating a continuously updated average price over a specific time period. It takes the jagged, erratic line of a stock chart and transforms it into a clean, gentle curve, making it easy to spot the prevailing direction. This essential indicator is the foundation for countless Moving Average strategies and is used daily by professional traders to confirm trends, identify dynamic support and resistance levels, and generate powerful buy and sell signals.
By the end of this guide, you will know the difference between the main types of MAs, understand the best settings for your style, and be ready to deploy the most popular MA strategies in your own trading.
The Ultimate Time Saver: Analyze Any Chart in 1 Click 📊⏱️
You understand the complexity involved in manually cross-referencing trends, RSI, EMAs, and volume. You even understand the top stock chart patterns and how to interpret their bullish or bearish meanings. But the financial markets move so fast that every minute spent manually analyzing a chart is an opportunity lost.
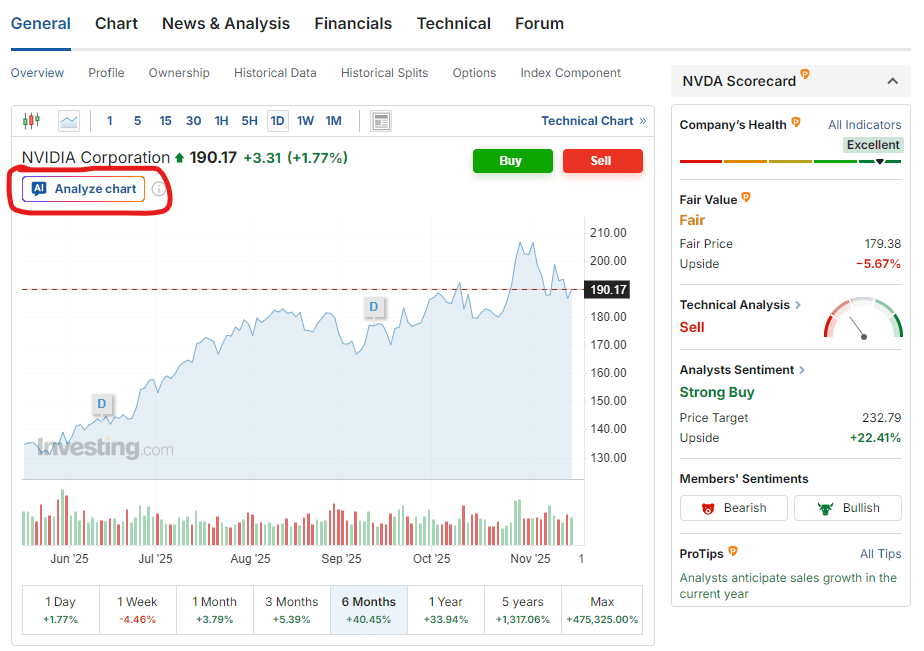
Investing.com’s exclusive WarrenAI tool cuts through the noise. Simply navigate to any stock, crypto, or commodity page on Investing.com and click ‘Analyze Chart’ button (as shown below).
The Moving Average Foundation: Types and Formulas
To effectively use moving averages, you must first understand the two primary types and the core difference in how they are calculated. The choice between them dictates how quickly your indicator reacts to new price action.
Simple Moving Average (SMA): The Pure Average

The Simple Moving Average (SMA) is the most basic form of the MA. It is calculated by taking the arithmetic average of a stock’s closing prices over a specified number of periods. Every price point in the calculation carries equal weight.
SMA = Sum of Closing Prices over n Periods / n
Because the SMA treats the price from 20 days ago the same as yesterday’s price, it reacts slowly to sudden market moves. This “sluggishness” is actually a strength for long term investors because it provides a very smooth line that effectively filters out volatility and short term noise.
Exponential Moving Average (EMA): The Sensitive Average

The Exponential Moving Average (EMA) is a more responsive type of moving average. Unlike the SMA, the EMA applies a greater weighting to the most recent closing prices.
This weighting means the EMA reacts much faster to current price changes than the SMA. The EMA will turn up sooner when a stock rallies and turn down faster when a stock sells off. This makes the EMA the preferred tool for short term traders such as day traders and swing traders who need quick confirmation of momentum shifts to time their entries and exits accurately.
The EMA line hugs the price closer, offering a quicker signal, though this speed comes with the risk of generating more false signals in choppy markets.
The Core Strategy: How MAs Generate Trade Signals
The power of the moving average lies in its simplicity. Traders use it in two main ways to convert price action into clear, rule based buy and sell decisions.
MA as Dynamic Support and Resistance (The Bouncing Price)
In a strong trend, the moving average line itself acts as a dynamic support and resistance level. This is one of the most practical ways to use moving averages in stock trading.
- In an Uptrend: A rising MA (like the 50-day EMA) often acts as a support level. When the stock price pulls back to the MA and “bounces” off it, it confirms the underlying bullish trend and often provides an excellent low risk buy signal.
- In a Downtrend: A falling MA acts as resistance. When the stock price rallies up to the MA and reverses back down, it confirms the bearish trend and provides a potential sell or short signal.
This strategy works because the moving average reflects the “fair value” or average price paid by recent traders. When the price dips to that fair value, new buyers often step in to defend the trend.
The Crossover System: Golden Cross and Death Cross
The most famous and widely followed MA strategy is the Crossover System, which involves plotting two moving averages—a short term (fast) MA and a long term (slow) MA—on the same chart. A crossover signals a major shift in the underlying trend and is often a self fulfilling prophecy because so many institutional traders follow it.
- The Golden Cross: This is a bullish buy signal that occurs when a short term MA (commonly the 50 period MA) crosses above a long term MA (commonly the 200 period MA). It signals that short term momentum has shifted strongly upward and is confirming a new long term uptrend.
- The Death Cross: This is a bearish sell signal that occurs when a short term MA (the 50 period MA) crosses below a long term MA (the 200 period MA). It signals that short term selling pressure is confirming a new, severe long term downtrend.
While these signals are powerful, they are lagging. They confirm a trend change only after the change has been well underway, which brings us to the importance of choosing the right settings.
Tactical Trading: Choosing Your MA Settings
There is no single “best” moving average setting; the correct period is entirely determined by your trading time horizon. The key is aligning your MA period with your goal.
Short Term Trading Periods (Day and Swing Trading)
Short term traders need MAs that are highly responsive to recent changes in momentum. They prefer the EMA due to its sensitivity.
| Time Horizon | Popular MA Periods (EMA) | Purpose |
|---|---|---|
| Day Trading / Scalping | 9 or 10 period | Used for quick, aggressive entry and exit signals on minute or hour charts. |
| Swing Trading (Days to Weeks) | 20 or 21 period | The most widely used MA for short term trends, often acting as the primary support/resistance level. |
| Medium Term Swing | 50 period | Used to confirm the intermediate trend. Swing trades are often taken in the direction of the 50 EMA. |
For a swing trader, an excellent Moving Average Strategy is to use the 9 EMA crossing the 21 EMA to generate a signal, while using the 50 EMA as a trend filter. If the 9 EMA is above the 21 EMA and the 50 EMA, the market is in a confirmed strong uptrend.
Long Term Investing Periods (Position Trading)
Long term investors and position traders (holding for months or years) prioritize a smooth signal that filters out all daily noise. They typically prefer the SMA.
- 50 day SMA: The standard measure for the intermediate term trend (roughly two months). It is closely watched by institutional traders.
- 200 day SMA: The definitive measure of the long term trend (roughly one trading year). Staying above the 200 day SMA is the consensus definition of a bull market, and falling below it is the consensus definition of a bear market.
When position trading, many investors simply use the stock’s relationship to the 200 day SMA as their primary filter: only buying or holding stocks that trade above this crucial line.
Validate Your Trend: Check Financial Health Before You Buy 🩺🚀
Your 200-day MA confirms the bull market. But is the company healthy enough to make the most of it?
Don’t take a long-term position based on a technical signal alone. InvestingPro’s Financial Health Score (like the example shown below) instantly rates a stock’s underlying fundamental strength.

Use this objective filter to ensure your MA-confirmed trend is sustainable!
Managing Risk: The MA’s Lagging Problem and Solutions
While powerful, the MA is a lagging indicator. It tells you what has already happened, not what will happen. This means MAs are prone to generating false signals, especially when a stock is trading sideways (in a range).
Filtering False Signals (Using Multiple MAs and Timeframes)
he best way to filter out the noise and avoid a “whipsaw” (a quick reversal after a false signal) is through a multi layered approach:
- Use Two or Three MAs for Alignment: Instead of relying on a single MA, wait until two or three MAs (e.g., 9, 21, and 50) are all moving in the same direction and aligned correctly (short above medium, medium above long). This confirms the trend strength.
- Combine with Other Indicators: Never use the MA alone. Use it as a price compass to confirm the trend, then use a momentum or volume indicator (like the Relative Strength Index or RSI) as the timing clock for entry. For instance, only enter a long trade confirmed by a Golden Cross if the RSI is also moving up from an oversold condition.
- Check Multiple Timeframes: Before entering a short term trade on an hourly chart, check the daily chart. If the daily trend (confirmed by the 50 day MA) contradicts your hourly signal, it is best to stand aside or reduce your trade size. The longer term trend should always take priority.
By adopting these practices, you move from simply reading a line on a chart to deploying a sophisticated, risk managed Moving Average Strategy.
Conclusion
The Moving Average remains one of the most effective tools in the technical analysis arsenal precisely because of its ability to simplify complex price action. It allows traders to step back from the daily panic and focus on the major, profitable trend.
Whether you choose the smooth stability of the SMA or the quick responsiveness of the EMA, your success hinges on one thing: consistency. Define your trading horizon, choose the appropriate MA setting (be it the 9 EMA for day trading or the 200 day SMA for long term investing), and implement a rule based Moving Average Strategy like the Golden Cross.
Recognize its limitations, always use it in tandem with other indicators, and respect the importance of trend confirmation. By mastering how to use moving averages in stock trading, you gain an indispensable edge in navigating the market.
Institutional-Grade Analysis, Immediate Results 🔎⏱️
The market moves fast, so make sure your insights move faster. Access WarrenAI’s instant technical analysis alongside the full suite of InvestingPro tools, including proprietary fair value calculations, advanced stock screening, financial health scores and AI-powered ProPicks.
Unlike other AIs that only analyze numbers, WarrenAI identifies visual patterns (candlestick formations, support levels, and trends) that make or break trades.
What WarrenAI Does Instantly: 🤖
🔎 Technical Summary: Provides a plain-language analysis of the current market structure, including trend, momentum, and key S/R levels.
⚠️ Risk Identification: Points out potential downside risks or failed signals the chart is flashing.
💡 Opportunity Spotlight: Highlights confirmed buy/sell signals based on institutional-grade algorithms, giving you a definitive edge.
🗺️ Trading Plan: Receive specific entry, stop-loss, and profit target prices based on technical analysis and risk/reward calculations that spot opportunities humans often miss.
Stop wasting time doing everything manually. Leverage WarrenAI to gain an instant edge to trade any market – across crypto, forex, commodities, stocks, ETFs and indices. Capture opportunities wherever they emerge, filtering hours of analysis into a concise, actionable report.
Don’t get left behind. Start your InvestingPro membership today.