

Imagine the market is like a massive rubber band. When stretched too far in one direction, it must inevitably snap back, or retrace, before moving forward again. The challenge for the individual investor is knowing how far that snapback will go. When should you jump in to “catch the boomerang” and ride the next wave?
This is where Fibonacci Retracements come in as one of the most powerful and widely used technical analysis tools for identifying high probability support and resistance zones. It translates the universal, mathematically beautiful concept of the Golden Ratio into a practical trading guide.
If you’re tired of chasing moves or guessing entry points, this step by step guide to using Fibonacci Retracements will provide the structure you need. We will show you exactly how to draw the tool, which levels truly matter, and how to combine them with smart risk management to find high conviction trade setups.
The Golden Foundation: Understanding the Fibonacci Sequence
The power of the Fibonacci tool lies in its mathematical roots.22 In the 13th century, Italian mathematician Leonardo Pisano, known as Fibonacci, introduced the world to a number sequence where each number is the sum of the two preceding ones: 23$0, 1, 1, 2, 3, 5, 8, 13, 21, 34, 55$, and so on.
The fascinating part is the ratios derived from this sequence:
- The Golden Ratio: When you divide any number in the sequence by the number immediately following it (e.g., 34 / 55), the result approaches 0.618 or 61.8%.
- Other Key Ratios: Dividing a number by the number two places to its right yields 0.382 or 38.2% (e.g., 21 / 55).
These ratios are found in everything from the spirals of a sunflower to the structure of the human body, suggesting a natural law of proportion. Golden Ratio trading theory posits that market prices, driven by mass human psychology and herd behavior, naturally follow these same harmonious proportions when they pull back.
The Ultimate Time Saver: Analyze Any Chart in 1 Click 📊⏱️
You understand the complexity involved in manually cross-referencing trends, Fibonacci Retracements, RSI, MACD, and volume. You even understand the top stock chart patterns and how to interpret their bullish or bearish meanings. But the financial markets move so fast that every minute spent manually analyzing a chart is an opportunity lost.
Investing.com’s exclusive WarrenAI tool cuts through the noise. Simply navigate to any stock, crypto, or commodity page on Investing.com and click ‘Analyze Chart’ button (as shown below).

Key Retracement Levels: The Market’s Sweet Spots
The retracement levels are the horizontal lines drawn on the chart that indicate where price is most likely to pause, reverse, or consolidate. The key levels are:
- 23.6%: A very shallow pullback, usually only seen in extremely strong, parabolic moves.
- 38.2%: A relatively shallow, yet common, pullback level, suggesting strong underlying momentum.
- 50.0%: While not a true Fibonacci ratio, the 50% retracement is a psychological midpoint and is widely respected by traders, often included by default on most charting software.
- 61.8%: The most significant and most-watched level, derived from the Golden Ratio. Price reversals here signal a healthy, sustainable trend continuation.
- 78.6%: A very deep retracement. A reversal here suggests that while the trend may continue, the prior move was highly exhausted.
The Golden Zone (50% to 61.8%)
For individual investors seeking a high probability entry point, the Golden Zone is your primary focus. This is the area between the 50% and 61.8% retracement levels.
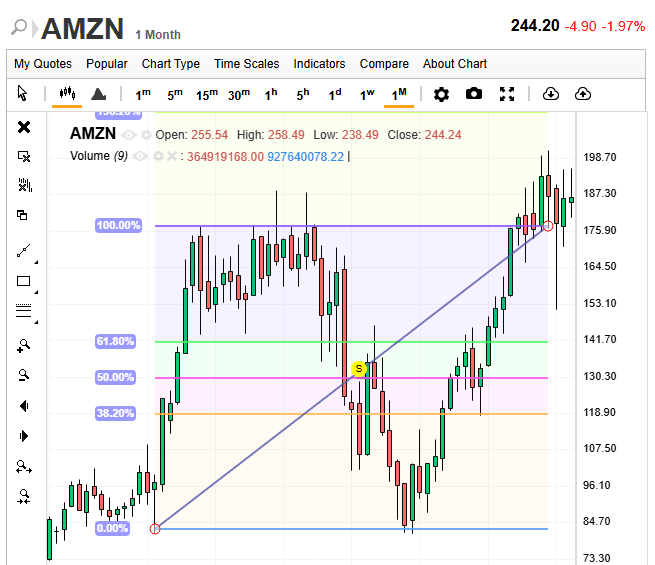
When price enters this zone during a pullback, the market is signaling a balanced return to value before launching the next leg of the trend. This is where you should be most alert for confirmation signals.
Step by Step Guide to Drawing Fibonacci Retracements
The effectiveness of the tool depends entirely on selecting the correct anchor points on the chart. Here is your clear, three step process:
Step 1: Identify the Trend and Swing Points
First, ensure the asset is in a clear, discernible trend (uptrend or downtrend). Fibonacci Retracements are designed for trending markets, not for assets stuck in a horizontal trading range.
- Swing High: The highest high reached before the price began a significant move in the opposite direction.
- Swing Low: The lowest low reached before the price began a significant move in the opposite direction.
The key rule is: You must anchor the tool across a clear, single, dominant price move.
Step 2: Anchor the Tool Correctly (Uptrend versus Downtrend)
This is the most critical step for new users.
| Trend Direction | Where to Anchor 0% | Where to Anchor 100% | Levels Indicate |
|---|---|---|---|
| Uptrend (Bullish) | Swing Low (The start of the move) | Swing High (The end of the move) | Support zones for buying |
| Downtrend (Bearish) | Swing High (The start of the move) | Swing Low (The end of the move) | Resistance zones for short selling |
Problem: Where exactly should I anchor the tool?
Solution: Always anchor the 0% level at the start of the dominant, impulsive move and drag to the end of that move (the swing high and swing low).
Step 3: Interpret the Levels and Wait for Confirmation
Once the lines are drawn, price will eventually return to one of them. Do not simply buy or sell because the price touches a line. The level is merely a potential support or resistance area.
Look for a reversal signal at that level to confirm the trade. Common confirmations include:
- A strong candlestick pattern (e.g., a Hammer at the 61.8% level in an uptrend).
- Price bouncing off an already established Support or Resistance level that aligns with the Fibonacci line.
- A surge in trading volume at the moment of the reversal.
Beyond Entry: Using Fibonacci Extensions for Profit Targets
A comprehensive strategy doesn’t just focus on entry; it requires a clear exit plan. This is where Fibonacci Extensions come in. Once the price reverses off a retracement level (the “Springboard”) and breaks beyond the original Swing High (or low), extensions project the logical next targets.
The key extension levels are:
- 127.2%
- 138.2%
- 161.8% (The Golden Extension)
- 200%
These levels act as potential resistance (in an uptrend) or support (in a downtrend) and are ideal places to set Take Profit orders. For example, if you enter a long trade at the 61.8% retracement, the 161.8% extension is often a primary target.
The Confluence Edge: Combining Fibonacci with Other Tools
A single indicator can provide a signal, but confluence trading provides conviction. The most effective use of Fibonacci is when a retracement level aligns or converges with another known technical indicator.
Look for:
- Fibonacci + Moving Averages (MA): If the 61.8% retracement lines up almost perfectly with a widely watched moving average (like the 50 day or 200 day MA), the level’s reliability multiplies dramatically.
- Fibonacci + Price Action: When a Fibonacci level aligns with an area where the price previously acted as clear support or resistance, the combined signal is extremely strong.
Risk Management: Setting Stop Losses Strategically
Fibonacci Retracements are not perfect and will occasionally fail. This is why a disciplined risk management strategy is non-negotiable.
- Stop Loss Placement: Always place your stop loss order just beyond the next major Fibonacci level. For example, if you buy at the 61.8% retracement, your stop loss should sit safely below the next level, often the 78.6% level.
- The Rule: A violation (a definitive close beyond) of the 100% level (the original swing point) invalidates the entire setup. If the price breaks the 100% level, the trend is likely no longer retracing; it is reversing, and you should exit immediately.
Wrapping Up
Fibonacci Retracements offer the individual investor a framework for finding order in the seeming chaos of price action. By mastering the clear rules for drawing the tool and focusing on the Golden Zone of 50% to 61.8%, you can significantly improve your precision for entry and exit timing.
Remember: these levels are not magic. They are simply highly respected points of interest that become self fulfilling due to mass adoption. Use them to identify potential opportunities, confirm them with other indicators (the confluence edge), and always, always define your risk with a strategic stop loss.
Practice drawing these retracements on the major moves of your favorite stocks and begin trading with a new level of confidence.
Tired of Analysis Paralysis? 🤔📊
Manually tracking and cross-referencing MACD, RSI, Volume and Trends against daily Candlestick movements is overwhelming and time-consuming.
But what if you could instantly run a full technical health check on any chart and get the institutional-grade verdict in seconds?
What WarrenAI Does Instantly: 🤖
🔎 Technical Summary: Provides a plain-language analysis of the current market structure, including trend, momentum, and key S/R levels.
⚠️ Risk Identification: Points out potential downside risks or failed signals the chart is flashing.
💡 Opportunity Spotlight: Highlights confirmed buy/sell signals based on institutional-grade algorithms, giving you a definitive edge.
🗺️ Trading Plan: Receive specific entry, stop-loss, and profit target prices based on technical analysis and risk/reward calculations that spot opportunities humans often miss.
Stop wasting time doing everything manually. Leverage WarrenAI to gain an instant edge to trade any market – across crypto, forex, commodities, stocks, ETFs and indices. Capture opportunities wherever they emerge, filtering hours of analysis into a concise, actionable report. Don’t get left behind. Start your InvestingPro membership today.


