


What is EBITDA Interest Coverage Ratio?
The EBITDA Interest Coverage Ratio is a financial metric that measures a company’s ability to meet its interest obligations using its earnings before interest, taxes, depreciation, and amortization (EBITDA). This ratio is crucial for assessing a firm’s financial health and its capacity to service debt. It offers investors and analysts insights into a company’s operating profitability and financial stability, independent of non-cash expenses.
How to Calculate EBITDA Interest Coverage Ratio?
The formula to calculate the EBITDA Interest Coverage Ratio is as follows:

EBITDA Interest Coverage Ratio = EBITDA / Interest Expense
In this formula,
- EBITDA: Earnings before interest, taxes, depreciation, and amortization. It reflects a company’s profitability from core operations.
- Interest Expense: The total cost incurred by the company for borrowed funds.
This straightforward formula provides a quick snapshot of a company’s ability to cover its interest obligations with its earnings.

Example Calculation of EBITDA Interest Coverage Ratio
Consider a Company XYZ has the following data:
- EBITDA: $1,200,000
- Interest Expense: $300,000
- Additional Context: Company XYZ is a mid-sized manufacturing firm operating in a competitive market. It has recently expanded its operations, taking on new loans that have increased its interest obligations.
Use the formula,
EBITDA Interest Coverage Ratio = EBITDA / Interest Expense
EBITDA Interest Coverage Ratio = 1,200,000 / 300,000 = 4
Interpretation of Results
The calculated EBITDA Interest Coverage Ratio for Company XYZ is 4, meaning that for every dollar of interest expense, the company generates $4 in EBITDA. This is a positive sign and indicates that:
- Financial Health: Company XYZ has a strong ability to cover its interest obligations using earnings from its operations.
- Low Risk of Default: A ratio of 4 suggests that the company is unlikely to face immediate difficulties in servicing its debt.
- Investor Confidence: Investors and lenders are likely to view this company as financially stable, reducing its perceived risk.
Why is EBITDA Interest Coverage Ratio Important?
The EBITDA Interest Coverage Ratio plays a vital role in evaluating a company’s financial health and operational efficiency. Its importance spans multiple perspectives, including those of investors, lenders, and management.
Ignores Principal Repayments
The ratio only considers interest expenses and ignores principal repayments, which can be significant for debt-heavy companies.
Financial Risk Evaluation
This ratio acts as a key indicator of financial risk. It helps stakeholders identify companies that may struggle during economic downturns or periods of declining revenue.
Excludes Non-Cash Items
EBITDA does not account for depreciation and amortization, which might overstate a company’s actual cash flow.
Limited Industry Comparability
Different industries have varying capital structures and interest expense patterns, making direct comparisons challenging.
Focus on Operating Earnings
While useful for evaluating operating performance, the ratio does not account for other financial obligations like taxes or capital expenditures.
Early Warning Signal
The EBITDA Interest Coverage Ratio serves as an early warning signal for potential financial distress. A declining ratio over time may indicate that a company’s earnings are shrinking relative to its interest obligations, which could lead to liquidity issues.
How to Interpret EBITDA Interest Coverage Ratio?
- High Ratio (>3): Indicates excellent debt management and financial strength. Companies with a ratio above 3 are generally considered low-risk.
- Moderate Ratio (1.5–3): Suggests the company is capable of meeting its interest payments but may face challenges if earnings decline.
- Low Ratio (<1.5): A warning sign that the company may not generate enough earnings to cover its interest expenses, posing a risk of default.
What is a Good EBITDA Interest Coverage Ratio?
A ‘good’ EBITDA Interest Coverage Ratio varies by industry but is typically considered:
- Above 3: Healthy and robust.
Meanwhile, merely satisfactory or concerning ratios would be:
- 1.5–3: Satisfactory but could indicate vulnerability during downturns.
- Below 1.5: A potential red flag for investors and lenders.
In capital-intensive industries, slightly lower ratios may be acceptable due to high operating costs.
Limitations of EBITDA Interest Coverage Ratio
The EBITDA Interest Coverage Ratio is a pivotal tool for investors and analysts to assess a company’s financial stability and debt-servicing capacity. While it offers valuable insights, it is not without limitations. A thorough analysis, including complementary metrics, is essential for making informed investment decisions.
Excludes Capital Expenditures
EBITDA does not account for capital expenditures (CapEx), which can be significant for companies in capital-intensive industries such as manufacturing, telecommunications, or energy. High CapEx requirements might reduce the actual cash available to meet interest payments.
- Example: A manufacturing firm might report a strong EBITDA Interest Coverage Ratio but struggle with liquidity due to ongoing investments in equipment and infrastructure.
- Implication: Relying solely on this ratio may overstate a company’s financial health.
Not a Cash Flow Metric
EBITDA is not equivalent to actual cash flow, as it does not consider changes in working capital, taxes, or other cash requirements. A company with a high EBITDA may still have insufficient cash to meet its interest obligations due to poor cash flow management.
- Example: A company with substantial accounts receivable might report strong EBITDA but struggle to collect cash on time to pay interest.
- Implication: Cash flow metrics, such as Free Cash Flow to Debt, should be considered alongside this ratio.
Limited Use for Industry Comparisons
The applicability of the EBITDA Interest Coverage Ratio varies widely between industries due to differing capital structures, operating models, and interest expense norms.
- Example: A utility company with steady cash flows may operate sustainably with a lower ratio, while a tech company with minimal debt would be expected to have a higher ratio.
- Implication: Comparing the ratio across industries without accounting for these differences can lead to incorrect conclusions.
Vulnerability to Manipulation
Companies may manipulate EBITDA figures to present a more favorable ratio. Adjustments such as excluding certain operating expenses or including one-time gains can artificially inflate EBITDA, making the ratio less reliable.
- Example: A company may exclude restructuring costs from EBITDA to show a higher ratio, despite those costs being recurring in nature.
- Implication: Investors should scrutinize the components of EBITDA to ensure transparency.
Lack of Context Without Complementary Metrics
The EBITDA Interest Coverage Ratio is most effective when used in conjunction with other financial metrics, such as leverage ratios, profitability ratios, and liquidity ratios. On its own, it may not provide a complete picture of financial health.
- Example: A company with a strong ratio but poor liquidity may still face financial challenges.
- Implication: A holistic approach to financial analysis is essential.
How to Find EBITDA Interest Coverage Ratio?
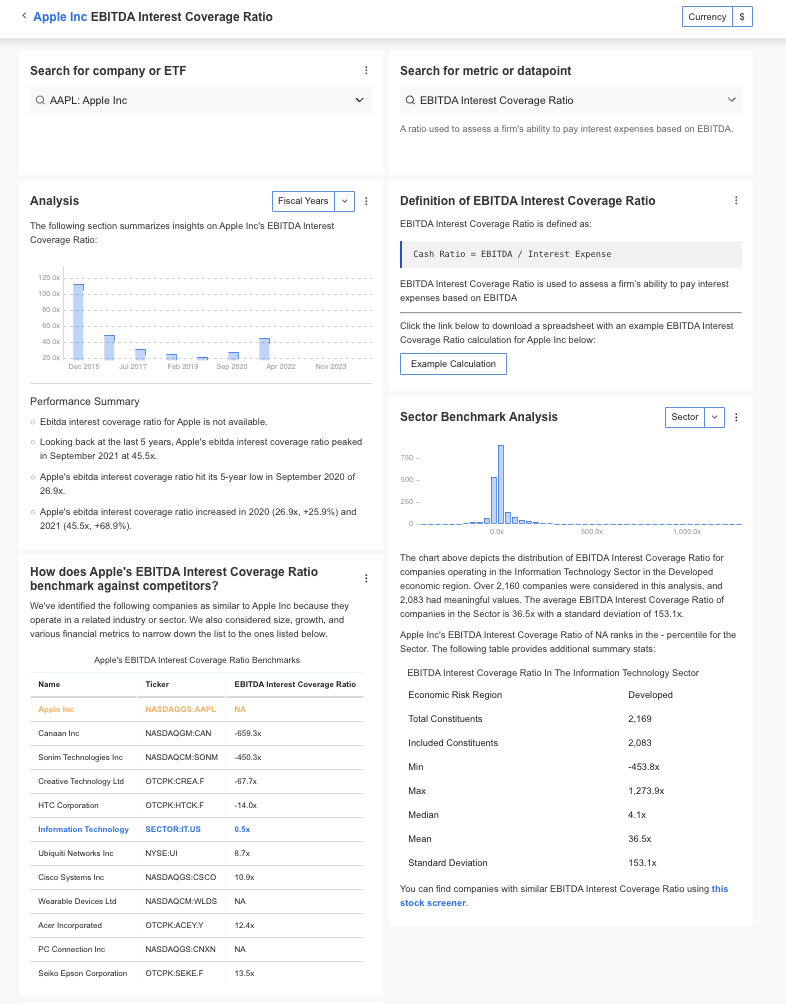
InvestingPro offers detailed insights into companies’ EBITDA Interest Coverage Ratio, including sector benchmarks and competitor analysis.
InvestingPro+: Access EBITDA Interest Coverage Ratio Data Instantly
Unlock Premium Data With InvestingPro 📈💸
Gain instant access to EBITDA Interest Coverage Ratio data within the InvestingPro platform
🛠 Access to 1200+ additional fundamental metrics
🔍 Competitor comparison tools
📊 Evaluate stocks with 14+ proven financial models
EBITDA Interest Coverage Ratio FAQ
What is the difference between EBITDA and EBIT?
EBIT includes depreciation and amortization, while EBITDA excludes these non-cash expenses, offering a clearer view of operating performance.
Can a company with a low ratio be financially stable?
It depends on the company’s business model and industry. Firms with predictable cash flows, like utilities, may operate sustainably even with lower ratios.
How often should the ratio be calculated?
Typically, it is calculated quarterly or annually to align with financial reporting periods.
Is EBITDA the same as cash flow?
No, EBITDA excludes changes in working capital, capital expenditures, and other cash flow items.
What happens if the ratio is negative?
A negative ratio indicates that the company’s EBITDA is insufficient to cover interest expenses, signaling severe financial stress.


