Investing.com

  • Academy Center
  • Markets
  • News
  • Analysis
  • Charts
  • Technical
  • Tools
  • Watchlist
  • Webinars
  • InvestingPro
      Academy
      • Stocks
      • Crypto
      • Trading
      • ETFs
      • Currencies
      • Analysis
      • Statistics
      • Stock Picks
      • Financial Terms
      • Global Stock Picks
      • InvestingPro 101
      • Tools

      Table of contents

      • What Is Dividend Per Share (DPS)?
      • How to Calculate Dividend Per Share?
      • Example Calculation of DPS Calculation
      • Why is Dividend Per Share Important?
      • How to Interpret DPS?
      • Factors Influencing DPS
      • How to Find Dividend Per Share?
      • InvestingPro: Access Dividend Per Share Data Instantly
      • FAQs About Dividend Per Share

      Academy Center > Analysis

      Analysis Beginner

      Dividend Per Share (DPS): Definition, Importance, Calculation & More

      written by
      Malvika Gurung
      arrow-top

      Financial Journalism

      Financial Journalist and Content Contributor at Investing.com

      B.Tech | Jaypee University of Engineering and Technology

      • linkedin logo
      See Full Bio
      | Edited by
      Rachael Rajan
      arrow-top

      Financial Markets Copyeditor - Investing.com

      Rachael has a Bachelor’s degree in mass media from Wilson College, Mumbai and a Master’s degree in English from Pune University.

      • linkedin logo
      See Full Bio
      | updated November 21, 2024

      What Is Dividend Per Share (DPS)?

      Dividend Per Share (DPS) is a financial metric that shows the amount of cash paid to shareholders for each share they own over a specific period, usually annually. It is an essential figure for income-focused investors, as it highlights the portion of a company’s earnings returned to its shareholders in the form of dividends. 

      DPS is a key indicator of a company’s profitability and shareholder return policy.

      How to Calculate Dividend Per Share?

      DPS is calculated by dividing the total dividends paid by a company over a certain period by the number of outstanding shares. 

      The formula is as follows:

      DPS = Total Dividends Paid / Shares Outstanding​

      This formula helps investors assess the actual cash return they are receiving per share, making it easier to compare dividend payouts across different companies.

      Example Calculation of DPS Calculation

      Let’s break down DPS with a practical example to show how it is calculated.

      Financial Year Example: Company XYZ

      For the financial year 2022-2023, Company XYZ declared the following dividends:

      • Interim dividend: $5 per share
      • Final dividend: $6.50 per share

      To calculate the total dividend per share, you simply add the interim and final dividends.

      Total dividend per share = 5 + 6.50 = 11.50

      Thus, the total DPS for the year is $11.50.

      Calculating DPS from Total Dividends

      Let’s consider another scenario where Company ABC announced a total dividend of $800,000 to be paid out in the next quarter. The company has 2 million shares outstanding. To calculate DPS:

      DPS = Total Dividend / Shares Outstanding = 800,000 / 2,000,000 = 0.40

      In this example, the DPS is $0.40.

      Estimating DPS Using the Income Statement

      DPS can also be estimated from the income statement by following a consistent dividend payout ratio. Let’s walk through the process:

      • Determine Net Income: Suppose Company B reported a net income of $15 million.
      • Find Shares Outstanding: The company has 12 million shares issued but holds 4 million shares in the treasury, leaving 8 million shares outstanding.
      • Calculate Earnings Per Share (EPS): Dividing net income by shares outstanding gives the earnings per share:

      EPS = 15,000,000 / 8,000,000 = 1.875

      • Apply the Payout Ratio: If Company B has historically paid out 50% of its earnings as dividends, then:

      DPS = 0.50 × 1.875 = 0.9375

      So, the estimated dividend per share for Company B is $0.94.

      Why is Dividend Per Share Important?

      Dividend Per Share (DPS) is a valuable metric for investors looking to understand a company’s financial health and commitment to returning profits to its shareholders. It is the simplest metric investors can use to determine the dividend payments they will receive from holding shares of a stock over time.

      By analyzing DPS, investors can gauge how much they stand to earn from dividends per share, helping them make informed decisions about where to allocate their capital.

      Investors often look at DPS in combination with other metrics, such as the dividend yield, to determine whether a stock aligns with their income objectives. For companies, a stable or growing DPS can enhance their attractiveness to income-seeking investors and help support share price stability.

      How to Interpret DPS?

      A rising DPS can indicate that a company is performing well, generating sufficient profits, and rewarding its shareholders. Conversely, a declining DPS might suggest potential financial challenges or a shift in corporate strategy.

      Factors Influencing DPS

      Several factors can affect a company’s DPS, including:

      Profitability: Companies with strong earnings are more likely to pay and increase dividends.

      Payout Ratio: The percentage of earnings paid out as dividends can affect DPS. A lower payout ratio might indicate a conservative dividend policy, while a higher ratio could suggest that a company is committed to distributing a significant portion of its profits.

      Business Strategy: Firms focusing on growth may prefer to reinvest profits rather than pay higher dividends, leading to a lower DPS.

      How to Find Dividend Per Share?

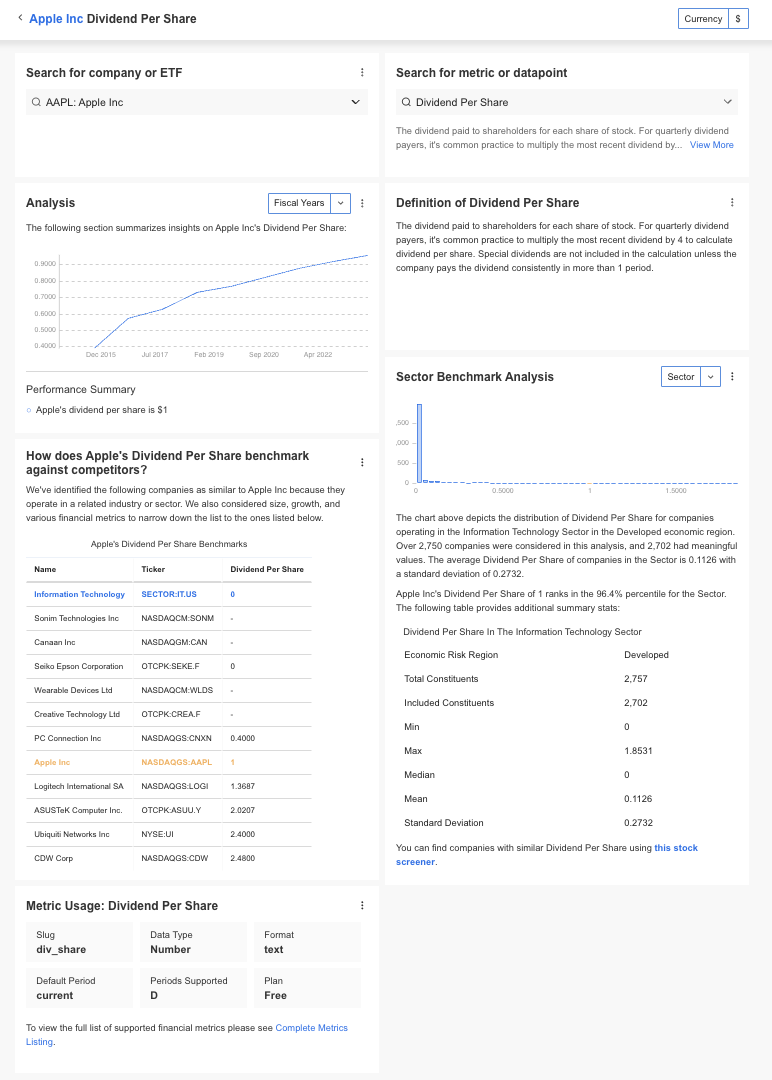
      InvestingPro offers detailed insights into companies’ Dividend Per Share (DPS) including sector benchmarks and competitor analysis.

      InvestingPro: Access Dividend Per Share Data Instantly

      Unlock Premium Data With InvestingPro 📈💸

      Gain instant access to DPS data within the InvestingPro platform

      🛠 Access to 1200+ additional fundamental metrics

      🔍 Competitor comparison tools

      📊 Evaluate stocks with 14+ proven financial models

      Outsmart the market with InvestingPro today!

      FAQs About Dividend Per Share

      How is DPS different from dividend yield?

      DPS measures the total cash dividend paid per share, while dividend yield shows the percentage return on investment from dividends relative to the stock price.

      Why is DPS important for income investors?

      Income-focused investors rely on steady or growing DPS for a reliable income stream. DPS helps them evaluate whether a company provides consistent returns.

      What happens if DPS decreases?

      A decrease in DPS could signal financial difficulties or a shift in the company’s strategy toward reinvesting earnings instead of returning them to shareholders.

      How often are dividends paid?

      Dividends can be paid quarterly, annually, or on a special one-time basis. DPS is typically calculated annually, but some companies also report interim DPS figures.

      Can a company have a high DPS and still be risky?

      Yes, while a high DPS might attract investors, it can also be a red flag if the company is paying out more than it earns, which may not be sustainable in the long run.

      Related Terms

      • What Is the Market Risk Premium? A Simple Guide for Investors
      • How to Find Value Stocks: A 4-Step Guide for the Intelligent Investor
      • What is the Capital Asset Pricing Model (CAPM)? A Complete Guide
      • How to Evaluate Quantum Computing Stocks: A Comprehensive Guide
      • What Is the Equity Multiplier? A Guide to Understanding Financial Leverage
      • How to Find Growth Stocks with Strong Fundamentals: A Practical Guide
      • How to Evaluate Cannabis Stocks: A Beginner's Guide to Technical and Fundamental Analysis
      • Cash Flow Quality: The Ultimate Guide to Finding Financially Healthy Companies
      • What Is a Dividend Reinvestment Plan (DRIP)? A Complete Guide
      • What is Technical Analysis? A Beginner's Guide to Reading the Market's Story

      Recent Articles

      How to Use Moving Averages in Stock Trading: Strategies for Entry and Exit Signals

      The stock market is a turbulent sea of constantly shifting prices, driven by news, sentiment, and volume. For new traders, the daily fluctuations can feel

      Step-by-Step Guide to Fibonacci Extensions in Stock Analysis

      For active investors, the challenge is not typically finding a good stock or an entry point; it’s knowing where to get out. When a stock

      Beginner’s Guide to Using Price Action in Stock Charts

      For many investors and traders, looking at a stock chart means navigating a confusing array of lines, squiggles, and colorful technical indicators like the RSI,

      How to Use Oscillators to Confirm Stock Trends

      As an investor, you’ve likely grappled with one of the most fundamental questions in the stock market: Is this trend real, or is it just


      Install Our Apps

      Scan the QR code or install from the link

      www.facebook.comApp Store www.twitter.comGoogle Play

      www.investing.com
      • Blog
      • Mobile
      • Portfolio
      • Widgets
      • About Us
      • Advertise
      • Help & Support
      • Authors
      Investing.com
      www.facebook.com www.twitter.com

      Risk Disclosure: Please be fully informed regarding the risks and costs associated with trading the financial markets, it is one of the riskiest investment forms possible. Currency trading on margin involves high risk, and is not suitable for all investors. Before deciding to trade foreign exchange or any other financial instrument you should carefully consider your investment objectives, level of experience, and risk appetite. Fusion Media may be compensated by the advertisers that appear on the website, based on your interaction with the advertisements or advertisers.

      Fusion Media does not endorse any product or service and does not assume any liability regarding your interaction with any third party displayed on this site, including the nature, quality, supply or fitness for a particular purpose of the product or service, or any damage caused as a result of the use of such product or service.


      © 2007-2025 Fusion Media Limited. All Rights Reserved
      • Terms And Conditions
      • Privacy Policy
      • Risk Warning
      • Do Not Sell My Information