


What is Degree of Operating Leverage?
The Degree of Operating Leverage (DOL) measures how a company’s operating income responds to changes in sales. It provides insight into the relationship between fixed and variable costs and their impact on profitability. High DOL indicates that a small percentage change in sales can lead to a significant change in operating income.
How to Calculate DOL?

The formula to calculate the Degree of Operating Leverage is:
DOL = Percentage change in EBIT / Percentage change in Sales
Here EBIT stands for Earnings Before Interest and Taxes.
There is also an alternate way to express DOL.
DOL = Contribution Margin / Operating Income
Here, the Contribution Margin is the difference between sales and variable costs.

Example Calculation of DOL
Consider a company with fixed costs of $500,000, variable costs of $2 per unit, and selling price of $10 per unit.
If the company sells 100,000 units, the Contribution Margin would be ($10 – $2) * 100,000 = $800,000. If operating income is $300,000, the DOL would be:
DOL = 800,000 / 300,000 = 2.67
This means a 10% increase in sales would lead to a 26.7% increase in operating income.
Why is DOL Important?
Understanding the Degree of Operating Leverage is vital for investors and managers to gauge the financial health and risk profile of a company, especially in industries with significant fixed costs. It is crucial for understanding the risks and benefits associated with a company’s cost structure.
Companies with high fixed costs relative to variable costs will exhibit high operating leverage, meaning their earnings are more volatile with changes in sales. This can be beneficial in periods of rising sales but risky when sales decline.
By analyzing DOL, stakeholders can better anticipate the impacts of sales fluctuations on a company’s profitability.
How to Interpret DOL?
A high DOL indicates that a company has a larger proportion of fixed costs compared to variable costs. This suggests that the company’s earnings before interest and taxes (EBIT) are highly sensitive to changes in sales. When sales increase, a company with high operating leverage can see significant boosts in operating income due to the fixed nature of its costs. Conversely, if sales decline, the company still needs to cover substantial fixed costs, which can significantly hurt profitability.
For example, in a company with high DOL, a 10% increase in sales could lead to a more than 10% increase in EBIT, magnifying the impact on profitability. This leverage can be advantageous during periods of rising sales but poses higher risks during downturns.
A low DOL, on the other hand, suggests that a company’s variable costs are higher than its fixed costs. This means that changes in sales have a less dramatic impact on operating income. Companies with low operating leverage experience smaller fluctuations in EBIT with changes in sales. This structure provides stability, as lower fixed costs mean the company doesn’t require high sales volumes to cover its expenses.
For instance, a 10% increase in sales for a company with low DOL might result in a less than 10% increase in EBIT, indicating a more stable, albeit less responsive, profit scenario.
Key Considerations
- High DOL Benefits and Risks: Companies with high DOL benefit from significant profit increases during sales upswings but face substantial risks if sales decline. They must maintain high sales levels to cover fixed costs.
- Low DOL Stability: Companies with low DOL enjoy more stable profit margins since their higher variable costs allow them to adjust more easily to sales fluctuations. They face less risk during economic downturns but might not see substantial profit increases during booms.
How to Find DOL?
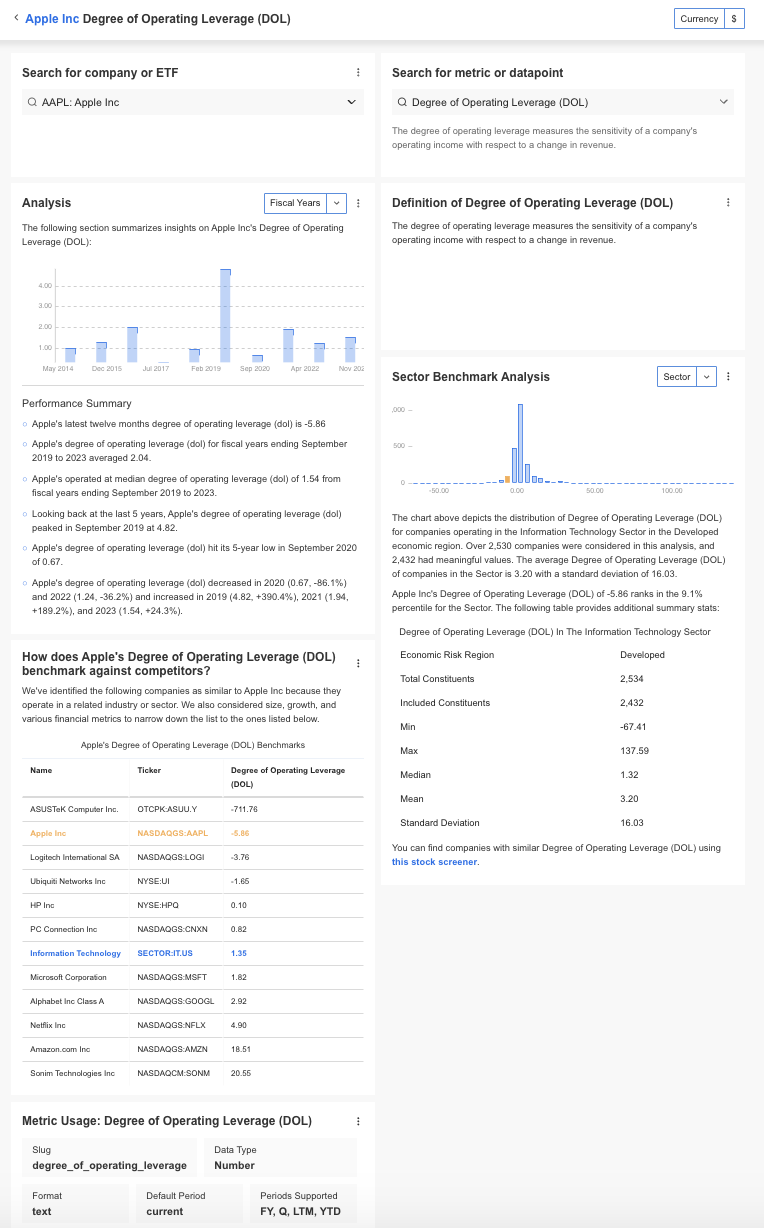
InvestingPro offers detailed insights into companies’ Degree of Operating Leverage (DOL) including sector benchmarks and competitor analysis.
Degree of Operating Leverage: FAQ
Why is DOL important for investors?
DOL helps investors assess the potential risks and rewards of a company’s cost structure, giving insights into how changes in sales might impact profitability.
What does a high DOL indicate?
A high DOL indicates that a company has a higher proportion of fixed costs, leading to greater sensitivity in operating income to changes in sales.
How can DOL affect decision-making?
Understanding DOL allows managers to make informed decisions about pricing, production, and investment by evaluating the potential impact of sales fluctuations on profitability.
Can DOL be used to compare companies?
Yes, DOL can be used to compare the operational risk of companies within the same industry, helping investors identify firms with higher or lower financial risk profiles.
What are the limitations of using DOL?
DOL is based on historical data and may not accurately predict future performance. Additionally, it does not consider the impact of external factors like market conditions and economic changes.


