

Compound Annual Growth Rate, or CAGR, is a key concept in finance and investing. Whether looking at a portfolio or a business, CAGR can provide a smoother, more consistent understanding of performance over time.
What Is CAGR?
The compound annual growth rate of a metric over time is equal to the average annual increase (or decrease) in that figure, compounded each year.
It’s the “compound” here that is key. Essentially, what CAGR shows is the precise average return that would be needed each year for a metric — an investment, or a company’s earnings — to get from Level A to Level B on a straight-line basis over a period of time.
CAGR Formula – How To Calculate CAGR
The formula for CAGR is as follows:
Where:
- BV – Beginning value, BV (starting value)
- EV – End value, EV (ending value)
- N– Number of periods
An example will be helpful here.
An investor wants to understand what growth she needs for her portfolio to rise from $100,000 to $300,000 over a decade. Her formula would be:
That boils down to 30.1 , or, put another way, the 10th root of 3. Our result here (as a scientific calculator will show) is 11.6%.
That figure admittedly might not be intuitive. Our investor is targeting 200% growth total over the 10-year period — so why is the answer not 20% per year, or 200% divided by ten?
The answer is in the key word here: compound. Again, we know that the gains are compounding over time. Our CAGR does not come off the initial base of $100,000, but instead off the base created each year.
And, indeed, if we list out our annual performance at the 11.6% compound annual growth rate, the math does check out:
- Year 0/Beginning Value: $100,000
- Year 1: $111,612
- Year 2: $124,573
- Year 3: $139,039
- Year 4: $155,185
- Year 5: $173,205
- Year 6: $193,318
- Year 7: $215,767
- Year 8: $240,822
- Year 9: $268,787
- Year 10/Ending Value: $300,000
InvestingPro+: Access CAGR Data Instantly
Unlock Premium Data With InvestingPro 📈💸
Gain instant access to CAGR data within the InvestingPro platform. Plus:
✓ Access to 1200+ additional fundamental metrics
✓ Competitor comparison tools
✓ Evaluate stocks with 14+ proven financial models
CAGR Formula Excel
Microsoft Excel does not have a standardized CAGR Formula. But we can create one relatively simply.
Let’s start by building a spreadsheet showing our portfolio’s uneven growth over time, from $100,000 to $300,000:
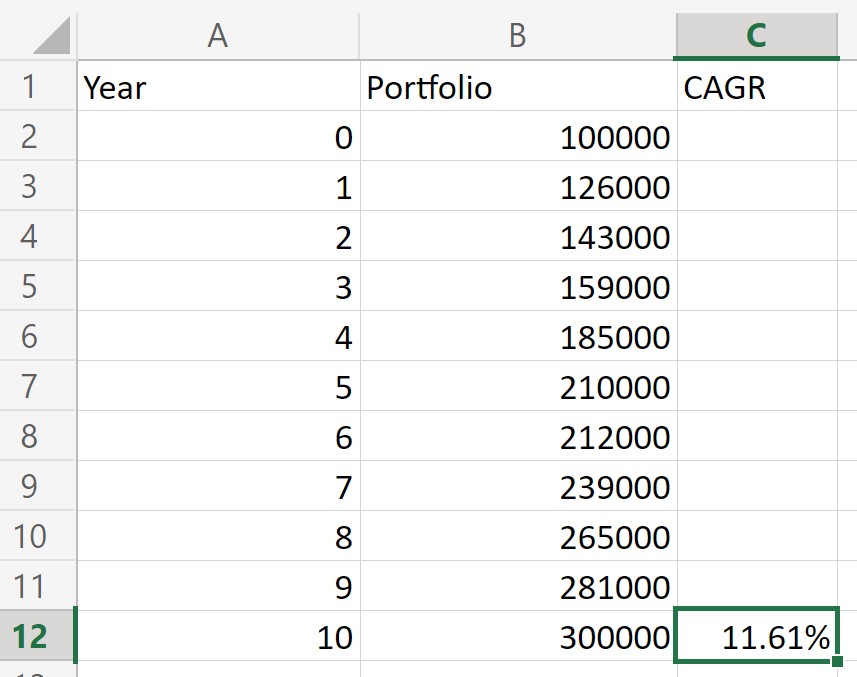
Our CAGR Formula in Excel is based on the mathematical formula for CAGR. We’re using the end value — $300,000 — in cell B12; the beginning value — $100,000 — in cell B2; and the period of years — 10 — in cell A10.
Remember our mathematical formula looks like this:
And so our Excel formula looks like this:
=((B12/B2)^(1/A12))-1
Now, we can actually add some color and detail here, by creating a calculator for compound annual growth rate for each year in our series:

To do that, we’re going to use an absolute reference for the beginning value of $100,000 in cell B2. In Excel, an absolute reference is signified by dollar signs ($) preceding the letter and number of the cell.
And so our formula begins at year 1, and looks like this (note the dollar signs in $B$2):
=((B3/$B$2)^(1/A3))-1
From our first insertion of the formula in cell C3, we can copy or fill down to C12, and get our CAGR output for each year. (Sadly, our investor has seen her performance weaken over time.)

What Does Negative CAGR Mean?
The examples used so far have shown positive performance. But negative CAGR can and does exist. If a portfolio or profits decline over time — if they show negative overall growth — then CAGR by definition will be negative.
Quite obviously, negative CAGR is not a good thing, for the same reason that negative growth of any kind (with rare exceptions) is not a good thing. Our investor does not want her portfolio to become less valuable. Companies do not want their earnings to decline.
There is one interesting mathematical wrinkle to negative CAGR to consider: the compounding effect works in reverse. For positive growth figures, using the compound annual growth rate highlights increases off a steadily larger base.
To use a simplistic example, a $100,000 portfolio growing at a 10% CAGR after five years is worth $161,051. (Our $100,000 base times 1.1 to the 5th power.) Five years of 10% growth compounded create a total increase of just over 61%.
The same portfolio shrinking at a 10% CAGR for five years, however, is not down 61%. The 10% declines are coming off a steadily lower base ($90,000 at the end of Year 1, $81,000 after Year 2, and so on). And so our portfolio in this model ‘only’ falls about 41% over the five years, to $59.049.
CAGR vs. AAGR
CAGR is not the only annual growth rate investors and businesses will refer to. Another metric, albeit one less used, is AAGR, or Average Annual Growth Rate.
The difference between CAGR and AAGR is the difference in the acronyms: the ‘C’ and the ‘A’. Again, CAGR is the compound returns over the period; AAGR is the average annual return over the period.
Let’s return to our previous example, in which we highlighted the growth of a portfolio from $100,000 to $300,000 over ten years. This time, we’ll calculate the year-over-year growth for each individual year:

To calculate AAGR, we’re simply going to take the average of these ten annual growth rates. In this example, our calculation (26.00% + 13.49% + 11.19%, etc. divided by ten) equals 11.79%.
The 11.79% AAGR is not terribly different from our CAGR of 11.61% in the same model. But that’s kind of the point. CAGR should show what the average annual return would be if the return was the same every single year. If the variance of actual returns — in this case, from 0.95% to 26.00% — isn’t that high, then the difference between AAGR and CAGR won’t be all that great.
But if the variance increases, then a gap can emerge. Let’s re-imagine our investor’s portfolio that still grows from $100,000 to $300,000 over ten years — but takes a far more winding path to get there:

Again, the ten-year CAGR for the portfolio does not change at all. It remains 11.61%. The ending value, beginning value, and time period are all the same.
But the performance year-by-year is far different, ranging from an 85% increase to a 21.48% decline. And so our investor’s AAGR now is 15.42%, a figure notably higher than the CAGR.
What CAGR does here is smooth the returns, so we can get a sense of overall performance across the period. What AAGR highlights is the arithmetic mean of the individual performances year by year.
Both figures have their merits — but as this example shows, the two figures clearly are not interchangeable. The choice of CAGR vs AAGR depends on precisely what an investor is looking to measure. CAGR shows the straight-line path from beginning value to ending value. AAGR, in many cases, highlights the volatility along the way.
The Rule of 72
The arithmetic behind CAGR, owing as it does to nth roots and the like, is usually not the kind that can be done without a calculator.
But there is one intriguing shortcut: the so-called ‘Rule of 72.’
The Rule of 72 can be used to estimate the CAGR needed for a value to double over a time period. The formula is quite simple:
Again, the Rule of 72 is an estimate — but it’s often a quite good estimate. A Rule of 72 calculation would imply a required CAGR of 7.2% to double one’s money in ten years; the actual figure is 7.18%. For seven years, the Rule of 72 suggests a 10.3% return, against 10.4% by the proper calculation.
The Rule of 72 only works when considering an ending value that’s double the beginning value. And there are some variations that offer more precise answers. But for back-of-the-envelope CAGR calculations, the Rule of 72 is a handy rule indeed.


