


What Is the Benjamin Graham Number?
The Graham Number or Benjamin Graham Number, named after Benjamin Graham, the father of value investing, is a valuation metric that helps investors determine the maximum price they should pay for a stock based on its earnings per share (EPS) and book value per share (BVPS).
This simple formula provides a quick way to screen for undervalued stocks, ensuring that investors adhere to the principle of buying securities at a discount to their intrinsic value.
How to Calculate the Graham Number?
The Graham Number is calculated using the following formula:

Graham Number = sqrt (22.5 × EPS × BVPS)
In this formula,
- EPS (Earnings Per Share): Indicates the company’s profitability.
- BVPS (Book Value Per Share): Represents the net asset value per share, providing insight into the company’s financial stability.
- 22.5: A constant that Graham suggested, combining a maximum acceptable price-to-earnings (P/E) ratio of 15 and a price-to-book (P/B) ratio of 1.5.
The result represents the maximum price an investor should pay for a stock to ensure a margin of safety.
Example Calculation of the Graham Number
Consider a company that has the following financial details:
- Earnings Per Share (EPS): $6
- Book Value Per Share (BVPS): $40
Calculating the Graham Number:
Graham Number = √(22.5 × EPS × BVPS)
Graham Number = √(22.5 × 6 × 40) = √5400 = 73.48
The Graham Number is approximately $73.48. This means that, according to Benjamin Graham’s formula, the maximum price you should pay for this stock to ensure a margin of safety would be $73.48.
Comparing the Graham Number to the Market Price:
- If the stock is trading below $73.48, it may be considered undervalued, providing a potential investment opportunity.
- If the stock is trading above $73.48, it might be overvalued, and the investor may need to exercise caution.
Why is the Graham Number Important?
The Graham Number is an invaluable tool for value investors seeking to identify stocks that are undervalued and to assess their intrinsic value. By calculating the maximum price to pay for a stock based on its earnings and book value, investors can ensure they are buying at a discount, providing a margin of safety and minimizing risk. For investors looking for a straightforward and reliable way to evaluate stocks, the Graham Number provides a practical and effective solution.
How to Interpret the Benjamin Graham Number?
Interpreting the Graham Number involves understanding the intrinsic value of a stock and its relation to its market price. The number itself provides a quick assessment of whether a stock is undervalued or overvalued. Here’s how to interpret the high and low values of the calculation:
High Graham Number Interpretation
- Stock is Overvalued: If the market price of the stock is above the Graham Number, the stock is considered overvalued. This indicates that the current market price exceeds the estimated intrinsic value, meaning the stock may be priced too high relative to its earnings and book value.
- Potential Risk: Buying stocks above the Graham Number may expose the investor to greater risk, as the stock could experience price declines if the market corrects itself or the company’s performance doesn’t meet expectations.
- Market Overreaction: A high Graham Number relative to the stock’s market price may also indicate that the market has overreacted to good news or overly optimistic growth expectations, leading to an inflated stock price.
Low Graham Number Interpretation
- Stock is Undervalued: If the market price is below the Graham Number, it suggests the stock is undervalued. The stock is being traded at a price lower than its intrinsic value, presenting a potential investment opportunity for those following a value investing strategy.
- Margin of Safety: A low market price relative to the Graham Number indicates that the investor is purchasing the stock at a discount, which reduces risk and offers a margin of safety. The company’s strong earnings and book value support the price, offering protection against significant losses.
- Buying Opportunity: When the stock price is below the Graham Number, it can signal that the market is undervaluing the company, creating an opportunity to buy shares at a potentially favorable price for long-term growth.
Advantages of the Graham Number
Here are the key benefits of using the Graham Number:
Identifies Undervalued Stocks
Helps determine if a stock is priced below its intrinsic value, signaling a potential buying opportunity.
Provides a Margin of Safety
Ensures investors don’t overpay by buying stocks at a discount to intrinsic value, reducing the risk of loss.
Simplifies Valuation
Uses easily accessible data (EPS and BVPS) to quickly assess a stock’s intrinsic value, ideal for investors without in-depth analysis resources.
Encourages Conservative Investing
Focuses on companies with solid fundamentals, preventing speculative, high-risk investments.
Best for Value Stocks
Particularly effective for companies with stable earnings and strong asset bases, such as in mature industries.
Supports Risk Management
By avoiding overpaying, it helps protect against significant losses due to market price drops.
Facilitates Stock Comparison
Allows investors to compare intrinsic values across companies within the same sector, aiding in decision-making.
Aligns with Long-Term Strategies
Supports a long-term investment approach by buying undervalued stocks and holding them as they appreciate in value over time.
Practical Applications of the Graham Number
- Screening for Value Stocks: Investors can use the formula to quickly shortlist undervalued stocks for further analysis.
- Risk Management: Provides a margin of safety by identifying stocks priced below their intrinsic value.
- Sector Selection: Especially effective for mature industries with stable earnings and tangible assets.
Graham Number vs. Other Valuation Metrics
Graham Number vs. Price-to-Earnings (P/E) Ratio
- Graham Number: Considers both earnings and book value for a comprehensive valuation.
- P/E Ratio: Focuses solely on earnings, ignoring the company’s asset base.
Graham Number vs. Discounted Cash Flow (DCF)
- Graham Number: Simple and quick, but lacks future cash flow projections.
- DCF: Accounts for projected cash flows, offering a more dynamic valuation but requires detailed assumptions.
Limitations of Graham Number
- Sector-Specific Applicability: Works best for stable, asset-heavy industries like manufacturing and utilities but may not be suitable for tech or growth companies.
- No Growth Factor: Does not account for future growth potential, making it less relevant for high-growth sectors.
- Dependence on Accurate Data: Relies on accurate EPS and BVPS figures, which can vary due to accounting methods.
How to Find Benjamin Graham Number?
InvestingPro offers detailed insights into companies’ Benjamin Graham Number including sector benchmarks and competitor analysis.
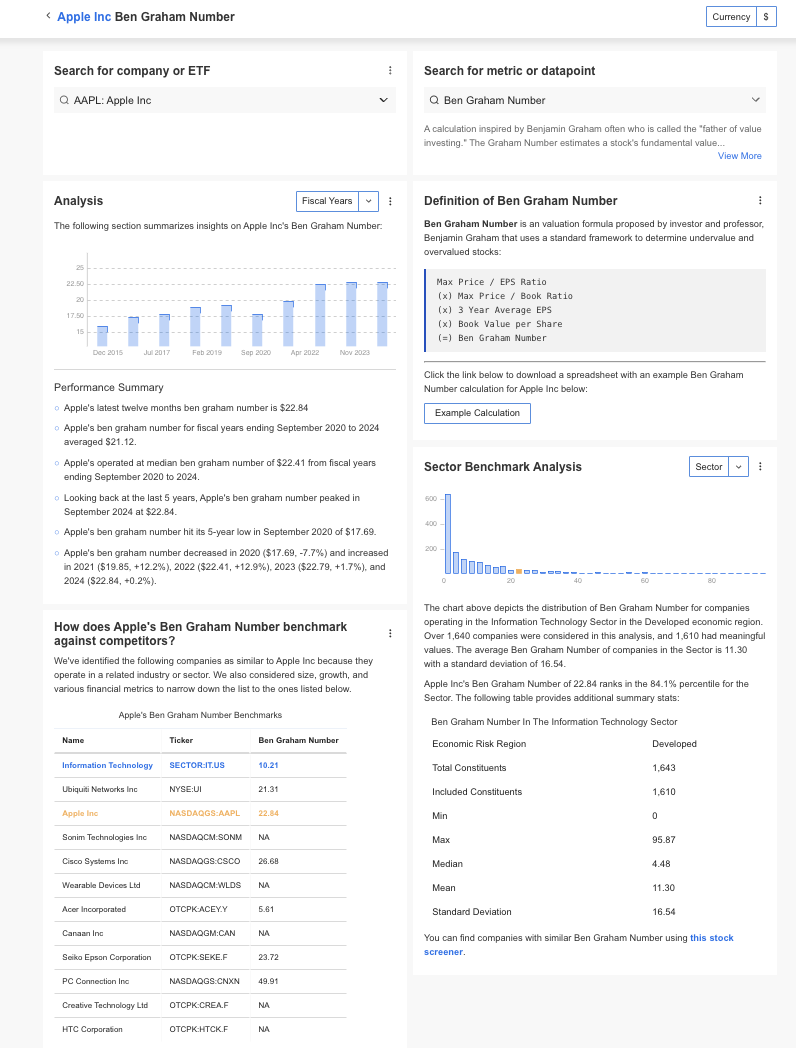
InvestingPro+: Access Benjamin Graham Number Data Instantly
Unlock Premium Data With InvestingPro 📈💸
Gain instant access to Benjamin Graham Number data within the InvestingPro platform
🛠 Access to 1200+ additional fundamental metrics
🔍 Competitor comparison tools
📊 Evaluate stocks with 14+ proven financial models
Benjamin Graham Number FAQs
How Does the Graham Number Help in Value Investing?
It helps investors identify undervalued stocks by providing a maximum price to pay, ensuring a margin of safety.
Is the Graham Number Relevant for All Stocks?
No, it is most effective for companies with stable earnings and assets. Growth-oriented or speculative stocks may not align with its conservative approach.
Can the Graham Number Replace Other Valuation Methods?
No, it is a preliminary screening tool. Investors should complement it with other analyses, such as discounted cash flow (DCF) and qualitative assessments.
What Are Common Misinterpretations of the Graham Number?
While useful, it’s not a foolproof measure of a stock’s success. Growth stocks or companies with intangible, heavy assets may yield misleading results.


