


What is Average Total Assets?
Average total assets is a metric used to measure the average value of a company’s assets over a specific period. This figure is essential for evaluating the stability, efficiency, and performance of a business, especially in calculating key financial ratios. By examining the average total assets, analysts and investors can gauge how efficiently a company uses its resources to generate revenue and manage its operations.
How to Calculate Average Total Assets?
The average total assets figure is calculated by taking the sum of the company’s assets at the beginning and end of a period – often a fiscal year – and then dividing by two. This formula helps to smooth out any short-term fluctuations in the asset balance and provides a more accurate reflection of the company’s asset levels over time.

Average Total Assets = (Beginning Total Assets + Ending Total Assets) / 2
This straightforward calculation is commonly used in financial metrics such as Return on Assets (ROA) and Asset Turnover Ratio, where accurate averages are crucial for meaningful analysis.

Why is Average Total Assets Important?
Average total assets provide an essential benchmark for assessing how well a company uses its resources. Here’s why this metric holds significant value in financial analysis:
Stability and Financial Health
Calculating average total assets provides insight into a company’s financial stability by showing how asset levels are maintained over time. High average assets relative to liabilities can signal financial strength and stability, reassuring investors of the company’s resilience.
Performance and Efficiency Measurement
When combined with revenue and profit figures, average total assets enable analysts to evaluate the efficiency with which a company uses its assets. For example, calculating the Return on Assets (ROA) helps reveal how much profit is generated per dollar of assets, providing a snapshot of the company’s operational effectiveness.
Trend Analysis
Observing trends in average total assets over time can reveal growth or contraction in a company’s resource base. A steady increase in average total assets may indicate expansion, while a decline could signal issues with asset management or a need to reevaluate investments.
Applications of Average Total Assets
Average total assets serve as a foundational figure in analyzing financial health, resource efficiency, and risk. From small business assessments to large-scale corporate analysis, this metric offers insights that aid in evaluating stability, growth potential, and operational effectiveness.
Comparing Companies in the Same Industry
Investors and analysts frequently use average total assets to compare companies of similar sizes within an industry. By assessing ROA or asset turnover ratios, they can determine which companies are most effective in using their resources to generate profit or revenue.
Evaluating Growth and Investment Needs
Companies with steadily rising average total assets are often expanding their operations, which may require ongoing investment. By examining trends in average assets, investors can identify companies poised for growth and assess potential investment needs.
Assessing Risk and Capital Structure
By analyzing debt-to-asset ratios, companies can better understand their financial leverage. Comparing average total assets with total debt helps gauge if a company might be over-leveraged, a potential red flag for investors.
How Average Total Assets Inform Investment Decisions?
Average total assets are instrumental in guiding investment decisions by offering a comprehensive look at a company’s asset management and financial efficiency. For instance:
Efficient Resource Use: Investors may favor companies with high ROA and asset turnover ratios, indicating strong returns from existing assets.
Asset-Based Growth Potential: Consistent growth in average total assets can signal expansion, an attractive trait for growth-oriented investors.
Debt Evaluation: A comparison between average total assets and total debt levels helps assess financial risk, crucial for risk-averse investors.
Limitations of Average Total Assets
While average total assets offer valuable insights, there are limitations to consider:
- Impact of Asset Valuation Changes: Changes in asset valuation – such as appreciation or depreciation – can affect average total assets, sometimes making year-over-year comparisons less clear.
- Industry Differences: The interpretation of average total assets may vary significantly across industries. For example, asset-heavy industries like manufacturing will often have higher asset values than service-based sectors, affecting comparative metrics like ROA and asset turnover ratios.
- Ignoring External Factors: Average total assets alone don’t account for external factors such as market conditions or economic shifts. A high or low asset base must be considered alongside these factors to draw accurate conclusions.
Key Ratios Involving Average Total Assets
Average total assets play a central role in several key financial ratios, each providing valuable insight into different aspects of a company’s performance.
1. Return on Assets (ROA)
ROA is a widely used profitability metric that assesses how effectively a company generates net income from its assets. It is calculated as:
ROA = Net Income / Average Total Assets
A higher ROA indicates that a company is more efficient at converting its assets into profit. Investors often use ROA to compare the asset efficiency of companies within the same industry.
2. Asset Turnover Ratio
The Asset Turnover Ratio measures a company’s efficiency in generating sales from its assets. This ratio is particularly valuable in industries where asset use is integral to revenue generation, such as manufacturing. The formula is:
Asset Turnover Ratio = Net Sales / Average Total Assets
A higher asset turnover ratio suggests that a company effectively uses its assets to drive revenue, reflecting strong operational performance.
3. Debt-to-Total Assets Ratio
This ratio evaluates the proportion of assets financed by debt, offering insight into a company’s leverage. While this ratio typically uses total assets, average total assets can provide a more balanced perspective over time. The formula is:
Debt-to-Total Assets Ratio = Total Debt / Average Total Assets
A high debt-to-total assets ratio may indicate higher financial risk, as it suggests reliance on borrowed funds for asset acquisition.
How to Find Average Total Assets?
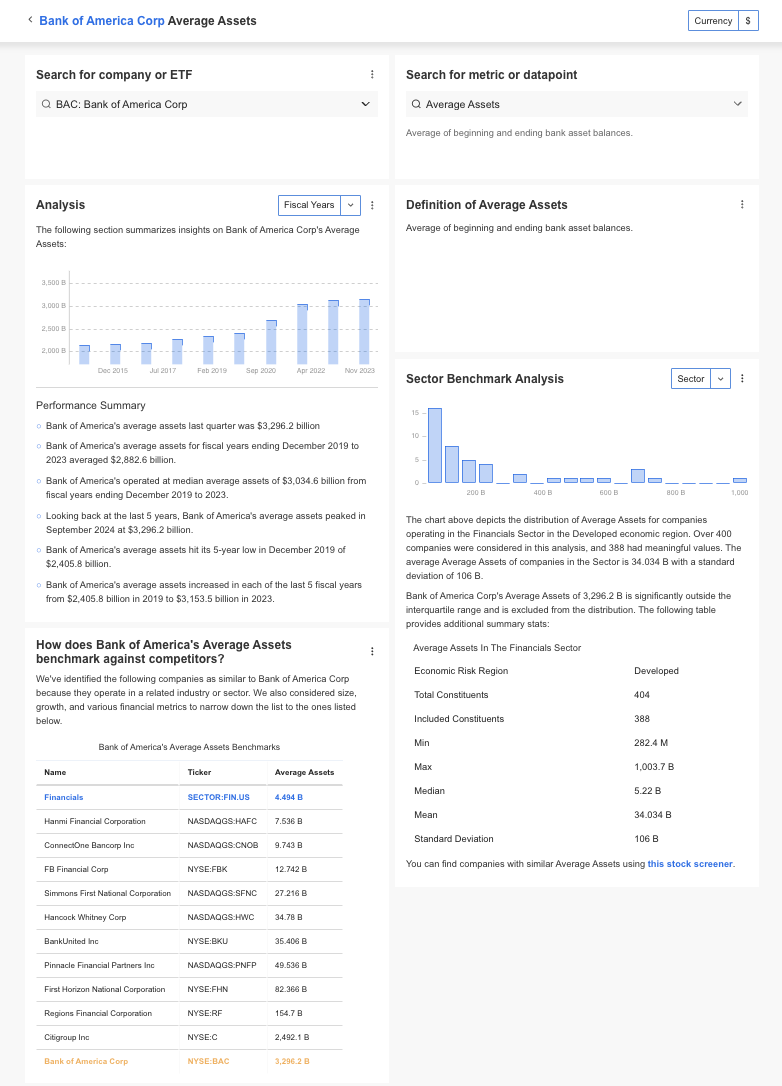
InvestingPro offers detailed insights into companies’ Average Total Assets including sector benchmarks and competitor analysis.
InvestingPro: Access Average Total Assets Data Instantly
Unlock Premium Data With InvestingPro 📈💸
Gain instant access to Average Total Assets data within the InvestingPro platform
🛠 Access to 1200+ additional fundamental metrics
🔍 Competitor comparison tools
📊 Evaluate stocks with 14+ proven financial models
Average Total Assets FAQs
How often should a company calculate average total assets?
Average total assets are typically calculated on an annual basis, using the values from the beginning and end of the fiscal year. However, companies might also calculate this figure quarterly for more frequent analysis.
Why use average total assets instead of ending total assets?
Average total assets provide a more balanced view by accounting for fluctuations throughout the period. This is especially helpful for metrics like ROA, where a single point in time may not reflect actual usage or trends in asset value.
Can average total assets be negative?
While rare, a negative asset figure could occur if liabilities exceed the total assets in cases of financial distress or bankruptcy. Negative average assets are typically a warning sign of severe financial instability.
How do average total assets differ from total assets?
Total assets refer to the actual amount of assets a company holds at a specific point in time. Average total assets, on the other hand, reflect an average value over a set period, offering a more representative view of asset levels throughout that period.
Is average total assets relevant to small businesses?
Yes, average total assets are relevant for businesses of all sizes. Small businesses can benefit from tracking average assets to understand trends in their financial health, even though they may use fewer complex ratios.


