


What is Average Daily Volume?
Average Daily Volume (ADV) is a metric used to measure the total number of shares or contracts traded for a specific security, such as a stock, on a given day, averaged over a defined period. It gives traders, analysts, and investors an idea of how actively a security is traded on a daily basis. Higher volumes typically signify greater liquidity, which is important for executing trades at desirable prices without significant price fluctuations.
Average Daily Volume (ADV) is an essential metric in financial markets, providing valuable insights into the liquidity, volatility, and market sentiment surrounding a particular asset. Investors and traders rely on ADV to make informed decisions about which securities to buy or sell and to understand how easily they can enter and exit trades.
How to Calculate Average Daily Volume
Calculating Average Daily Volume involves tracking the volume of shares traded for a specific security over a given number of days and then dividing the total by the number of days in that period. The formula is simple:
Average Daily Volume (ADV) = Total Volume Traded in a Period / Number of Trading Days

In this formula,
- Total Volume Traded: The sum of all shares or contracts traded during each day within the given period.
- Number of Trading Days: The number of days the market is open during the selected period.
Example Calculation of Average Daily Volume
Let’s break it down with a real-world example. Suppose we want to calculate the ADV for a stock over a 5-day period. The trading volumes for each day are as follows:
- Day 1: 800,000 shares
- Day 2: 1,200,000 shares
- Day 3: 1,500,000 shares
- Day 4: 1,100,000 shares
- Day 5: 900,000 shares
Now, to calculate the Average Daily Volume:
ADV = (800,000 + 1,200,000 + 1,500,000 + 1,100,000 + 900,000) / 5
Thus, the Average Daily Volume for this stock over the five-day period is 1.1 million shares.
The Ultimate Time Saver: Analyze Any Chart in 1 Click 📊⏱️
Manually tracking and cross-referencing MACD, RSI, Volume and Trends alongside daily Candlestick movements is overwhelming and time-consuming.
But what if you could instantly run a full technical health check on any chart and get the institutional-grade verdict in seconds?
Let WarrenAI do the heavy lifting on advanced chart analysis and receive specific entry, stop-loss, and profit target prices based on technical analysis and risk/reward calculations that spot opportunities humans often miss. Stop guessing and start trading with confidence.
Why is Average Daily Volume Important?
Average Daily Volume is especially useful for investors looking to assess the market activity of stocks, bonds, commodities, and other assets. ADV helps measure how often investors are willing to buy or sell a particular security, which in turn impacts market volatility and trading costs.
Understanding and tracking Average Daily Volume is important for several reasons:
- Liquidity Measurement: ADV is a key indicator of liquidity in a market. High daily volumes suggest that a stock can be bought or sold without drastically affecting its price, while low volumes may indicate that the stock could be more volatile or harder to trade at desired prices.
- Market Sentiment: A sudden spike or drop in ADV can indicate shifts in market sentiment or investor interest. For example, an increase in volume may signal that investors are reacting to news, earnings reports, or other significant events affecting the company or sector.
- Transaction Costs: A higher ADV typically correlates with lower transaction costs due to better liquidity. Investors may incur lower spreads (the difference between buying and selling prices) when trading stocks with high ADV.
- Volatility Analysis: By monitoring ADV, investors can better gauge the potential volatility of a stock. Large volume changes can indicate heightened risk or unusual price movements, especially during market stress.
- Stock Selection: Investors use ADV to select stocks for trading. Stocks with higher ADV are often favored by institutional traders and retail investors alike because of their liquidity, which reduces the risk of slippage.
What is a Good Average Daily Volume?
What constitutes a “good” Average Daily Volume varies depending on the asset being traded, the investor’s strategy, and the type of market. Here are some general guidelines:
- Large-Cap Stocks: For well-established companies like Apple or Microsoft, an ADV of several million shares per day is typical, reflecting high liquidity and ease of trading.
- Small-Cap Stocks: For smaller companies, an ADV of around 100,000 to 500,000 shares might be considered healthy. Lower volumes may indicate a lack of interest or lower investor participation.
- Penny Stocks: These stocks can have extremely low ADV, sometimes in the range of thousands of shares per day, making them riskier to trade due to lack of liquidity.
A “good” ADV is one that fits the investor’s trading strategy. For active traders, high volume may be more desirable to ensure they can enter and exit positions efficiently. Long-term investors might not focus as much on volume but may still consider it to gauge the stability of their investments.
What are the Limitations of Average Daily Volume?
By tracking Average Daily Volume (ADV) over time and analyzing changes in volume, market participants can identify trends, gauge investor interest, and assess the risk associated with different assets. However, like any financial metric, ADV should be used in conjunction with other indicators and analysis tools to gain a more comprehensive understanding of a security’s behavior and potential.
Few of its limitations include:
- Lack of Context: ADV alone doesn’t provide insight into price movements or trends. A stock with high volume could still experience significant volatility, especially if the underlying company is facing challenges, or if it’s heavily impacted by external factors.
- Can Be Distorted: Large one-time trades or events can significantly affect ADV. For example, a company might issue a large block of shares to institutional investors, causing a temporary surge in volume that could skew the ADV calculation.
- Doesn’t Reflect Market Sentiment Fully: ADV shows how much trading is happening, but it doesn’t provide information about whether buyers or sellers dominate the market. This can be important for understanding the strength of market trends.
- Limited to the Time Period: ADV is calculated over a set period, but this may not fully capture seasonality or irregular trading patterns. A stock’s liquidity could vary significantly in different market conditions.
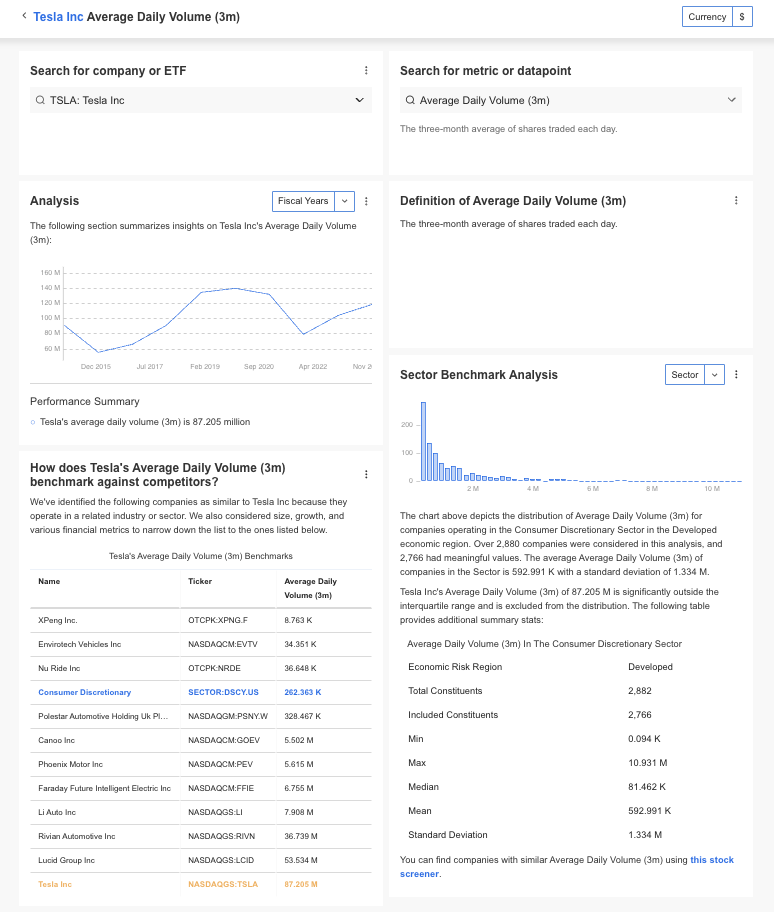
How to Find Average Daily Volume?
InvestingPro offers detailed insights into companies’ Average Daily Volume including sector benchmarks and competitor analysis.
InvestingPro+: Access Average Daily Volume Data Instantly
Unlock Premium Data With InvestingPro 📈💸
Gain instant access to ADV data within the InvestingPro platform
🛠 Access to 1200+ additional fundamental metrics
🔍 Competitor comparison tools
📊 Evaluate stocks with 14+ proven financial models
Average Daily Volume FAQ
How do I find the Average Daily Volume of a stock?
ADV data is readily available on most financial news platforms, stock brokerage platforms, and financial websites. It is usually displayed on a daily, weekly, or monthly basis.
Can ADV be used for non-stock assets?
Yes, ADV can be used to measure the liquidity of other assets, such as options, bonds, or commodities. The formula remains the same, though the volume unit might differ (e.g., contracts for options).
What does an increase in ADV indicate?
An increase in ADV typically signifies increased investor interest or a reaction to significant news, earnings reports, or market events. It can also signal the start of a trend or market movement.
Can low ADV lead to market manipulation?
Yes, low ADV may make a stock more susceptible to price manipulation, as fewer shares are being traded, making it easier for large trades to influence the stock price.
How does ADV impact day traders?
Day traders rely on high ADV for fast execution of trades and to minimize slippage. Stocks with higher ADV are more liquid, meaning they can be bought or sold more quickly without significant price changes.


