Bitcoin price today: steadies near $109k as US-China trade tensions re emerge
As of this writing, the Top 5 Technology names on the S&P 500 are Microsoft, (NASDAQ:MSFT), Apple (NASDAQ:AAPL), Amazon (NASDAQ:AMZN), Facebook (NASDAQ:FB) and Google (NASDAQ:GOOGL).
These names now comprise between 20% and 21% of the S&P 500.
Technically, Amazon is Consumer Discretionary, and Facebook and Google (Alphabet) are Communications names, but for all practical purposes it’s all “Tech.”

One way to check the quality of earnings for any company, let alone a tech company is to compare net income to cash-flow OR get another valuation look at what you think is a high P.E. company, look at the price-to-cash-flow or price-to-free-cash.
That’s what most retail investors miss – they read a “GAAP vs Non-GAAP” article and think “this is the way, the truth, and the light and I have found it” and the real answer is “well, not so much”. What investors sometimes don’t get is that GAAP earnings are riddled with “non-cash expenses” which ultimately don’t impact cash-flow thus look at cash-flow and free-cash as a litmus test.
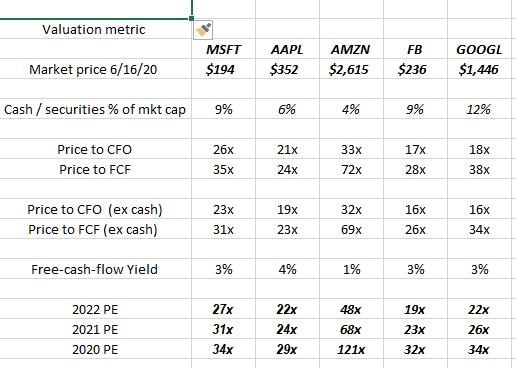
The above spreadsheet shows the cash-flow and free-cash-flow valuations on the 5 largest names in the S&P 500 as of tonight’s close and the comparison PEs.
All the companies have price-to-cash-flow valuations tonight cheaper than their respective PE ratio’s. That’s a good sign.
I also wanted to show and cash and short-term securities as a % of market cap to highlight the liquidity and cash-generation of these companies.
Granted the free-cash-flow yields (4-quarter trailing free-cash-flow divided by market cap) aren’t as large as they were in April ’20 but they are still higher than all the Treasury yields and even higher than the yields on a lot of corporate investment-grade bond funds.
