By Lewis Krauskopf
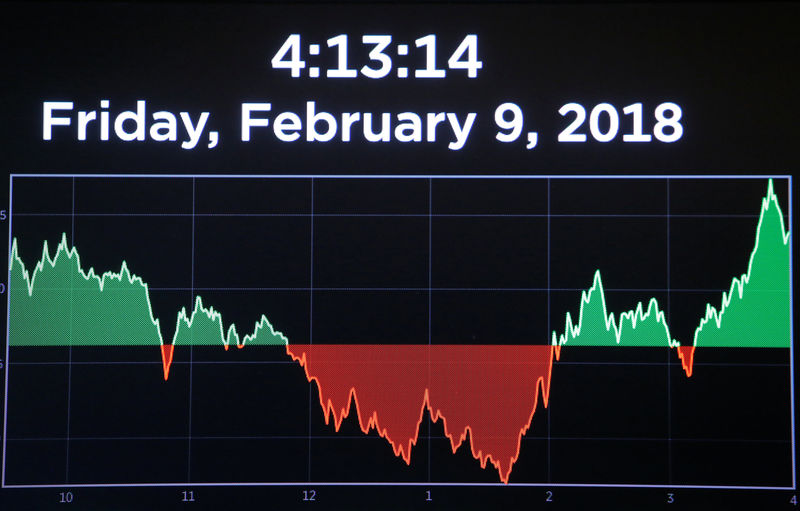
NEW YORK (Reuters) - U.S. stocks ended a wild week with a burst of buying, pushing the S&P 500 up 1.5 percent on Friday, but still recorded their worst week in two years, and investors braced for more volatile trading days ahead.
The sharp falls of the week confirmed the market was in a correction, down more than 10 percent from a Jan. 26 record high, and throwing the nearly nine-year bull market off course. The newly volatile market was shaken in part by rising bond yields, which led stock investors to rethink their positions after months of steady gains.
The S&P 500 ended the week nearly 9 percent below the all-time high set just two weeks ago.
“I don't see any reason to think that we're setting a pattern for next week or the rest of the year," said Rob Stein, chief executive officer of Astor Investment Management in Chicago. "The only pattern we're setting is more volatility."
On Friday alone, the S&P 500 swung from gains of up to 2.2 percent to declines of 1.9 percent, echoing the big swings of the past week. The Dow moved in a range of more than 1,000 points, a more modest change than on Monday when the Dow fell as much as nearly 1,600 points.
The Dow Jones Industrial Average (DJI) rose 330.44 points, or 1.38 percent, to 24,190.9, the S&P 500 (SPX) gained 38.55 points, or 1.49 percent, to 2,619.55, and the Nasdaq Composite (IXIC) added 97.33 points, or 1.44 percent, to 6,874.49.
Technology (SPLRCT) was the best-performing group on Friday, with Microsoft Corp (O:MSFT), Alphabet Inc (O:GOOGL) and Facebook Inc (O:FB) giving the biggest individual boosts to the S&P 500. Energy (SPNY) was the lone major S&P sector to end negative as oil prices tumbled.
(Graphic: S&P 500 Sector Performance - http://reut.rs/2Bk7XKJ)
The benchmark S&P 500 fell 5.2 percent for the week, its biggest weekly percentage drop since January 2016. For the week, the sector that got hammered the most was energy.
Ninety-six S&P 500 stocks are down 20 percent or more from their own one-year highs, according to Thomson Reuters data.
The sharp selloff in recent days was kicked off by concerns over rising inflation and bond yields, sparked by last week's January U.S. jobs report.
"You have a fundamental difference between the economy and earnings doing well, versus interest rates going up and inflation picking up, and it’s still a question of which will dominate," said Giri Cherukuri, head trader at OakBrook Investments LLC in Lisle, Illinois.
Equities for years have looked relatively attractive compared to the low yields offered by bonds, but the rise in Treasury yields has diminished the allure of stocks, especially with stock valuations at historically expensive levels.
The yield on benchmark 10-year U.S. Treasuries (US10YT=RR) hovered around 2.85 percent after touching a four-year peak of 2.885 percent on Monday.
“That’s part of this recalculation that has gone on in the market: How do we factor in higher bond yields?" said Willie Delwiche, investment strategist at Baird in Milwaukee. "And that is a process that is playing out."
U.S. fund investors sucked $23.9 billion out of the stock market in the latest week, marking the largest withdrawals from those funds on record, but bulls were still encouraged by strength in the global economy and solid U.S. corporate earnings.
Also, the percentage of Main Street investors expecting stocks to fall reached a three-month high in the American Association of Individual Investors' weekly survey.
(Graphic: Bearish sentiment among individual investors - http://reut.rs/2BkoI8t)
During Friday's session, the S&P 500 briefly broke below its 200-day moving average, a closely watched technical level, before rising.
"You will often see bounces off those levels," said Anwiti Bahuguna, senior portfolio manager at Columbia Threadneedle Investments in Boston.
The S&P 500 lost $2.49 trillion in market value from Jan. 26 through Thursday, according to S&P Dow Jones Indices.
Volatility remained high compared to recent months. The market's main gauge of volatility, the CBOE Volatility Index (VIX), fell 4.4 to 29.06 on Friday but was still nearly three times the average level of the past year.
In the latest day of strong trading volume, about 12 billion shares changed hands in U.S. exchanges on Friday, well above the 8.5 billion daily average over the last 20 sessions. It was the first time weekly volume eclipsed 50 billion since August 2015.
Advancing issues outnumbered declining ones on the NYSE by a 1.43-to-1 ratio; on Nasdaq, a 1.36-to-1 ratio favored advancers.

The S&P 500 posted no new 52-week highs and 47 new lows; the Nasdaq Composite recorded 17 new highs and 208 new lows.