By Chuck Mikolajczak
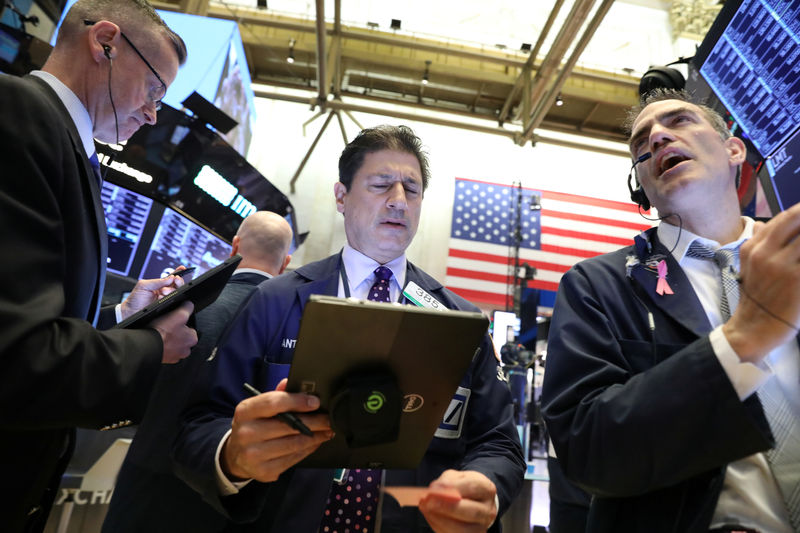
NEW YORK (Reuters) - U.S. stocks fell on Wednesday, with the S&P 500 and Nasdaq closing just above key support levels, as worries that a lengthy U.S.-China trade war would crimp global growth pushed investors into the safety of government bonds.
Trade tensions between the two largest economies in the world showed little signs of relaxing as Chinese newspapers warned that Beijing could use rare earth elements to strike back after President Donald Trump remarked on Monday that he was "not yet ready" to make a deal with China over trade. Rare earths are a group of 17 chemical elements used in everything from high-tech consumer electronics to military equipment.
Adding to worries, China's Huawei Technologies Co Ltd filed a lawsuit against the U.S. government late on Tuesday in its latest bid to fight sanctions from Washington.
"It is trade and the effect of trade. The problem is right now it is what I call an 'unquantifiable potential outcome' - so nobody really knows what is going to happen," said Sam Stovall, chief investment strategist at CFRA Research in New York.
"All we know is there is increasingly heated rhetoric regarding trade and if we are not careful we end up in a trade war that will definitely slow economic growth and possibly push us into recession," he added.
Each of the major U.S. indexes suffered their fourth decline in five sessions. The S&P is down 5.5% from its April 30 closing high. However, both the S&P 500 and Nasdaq managed to close just above their 200-day moving averages, seen as a key level of support.
The uncertainty in markets has pressured investors to dump equities and seek safety in U.S. government debt, which has led to an inversion of the yield curve between 3-month bills and 10-year Treasury notes, a precursor to a possible recession. Benchmark U.S. 10-year note yields touched a low of 2.21%, the lowest since September 2017.
Federal funds futures indicated that traders saw a nearly 58% chance the U.S. central bank would lower policy rates by at least a quarter of a percentage point at its Sept. 17-18 meeting, compared with a 50% likelihood late on Tuesday.
Each of the 11 major S&P sectors were in negative territory, with utilities the worst performer. The Dow Jones Industrial Average fell 221.36 points, or 0.87%, to 25,126.41, the S&P 500 lost 19.37 points, or 0.69%, to 2,783.02 and the Nasdaq Composite dropped 60.04 points, or 0.79%, to 7,547.31.
The Dow Jones Industrial Average closed at its lowest level since Feb. 11, while the S&P and Nasdaq ended the session at their lowest closing levels in nearly three months.
The benchmark S&P index briefly fell below its 200-day moving average, a key indicator of long-term momentum during the session.
Among other stocks, Johnson & Johnson (NYSE:JNJ) dropped 4.19% after a lawsuit that accused the drugmaker of fueling the U.S. opioid epidemic entered its second day of trial, pulling healthcare stocks down 1.20%.
Capri Holdings Ltd plunged 9.85% as the worst- performing S&P 500 component after the Michael Kors fashion business owner issued a disappointing first-quarter profit forecast as it spends more on marketing.
General Mills (NYSE:GIS) dropped 5.56% after Goldman Sachs (NYSE:GS) downgraded the cereal maker's stock to "sell."
Declining issues outnumbered advancing ones on the NYSE by a 2.05-to-1 ratio; on Nasdaq, a 2.23-to-1 ratio favored decliners.
The S&P 500 posted no new 52-week highs and 40 new lows; the Nasdaq Composite recorded 25 new highs and 213 new lows.
About 7.31 billion shares changed hands on U.S. exchanges, compared with the 7.04 billion daily average over the last 20 sessions.