By Caroline Valetkevitch
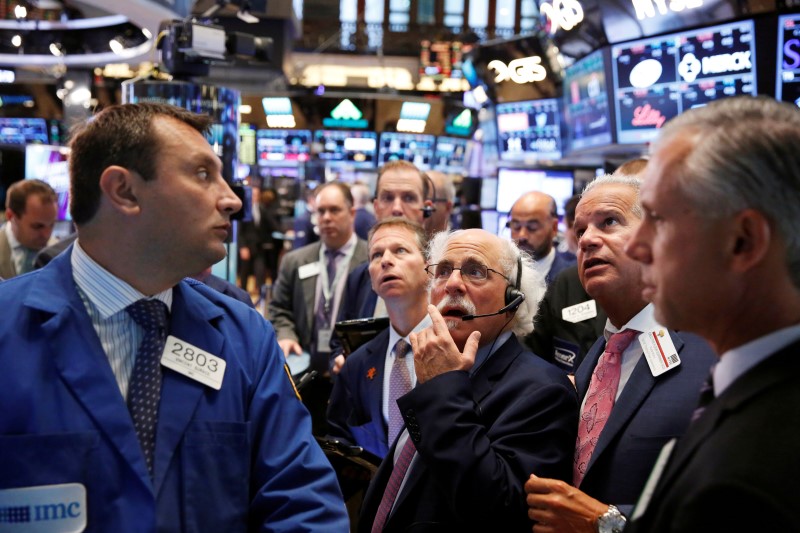
NEW YORK (Reuters) - U.S. stocks dropped on Friday, giving the S&P 500 its worst day since June as investor nervousness increased following a nuclear test by North Korea and Federal Reserve officials' comments lifted rate hike bets.
The CBOE Volatility index (VIX) closed at its highest level since late June, while the S&P 500 index closed below its 50-day moving average for the first time also in about two months, a sign that further weakness may be ahead.
The equity selloff also came as the U.S. Treasury yield curve continues to steepen. Long-dated yields reached more than two-month highs, after reports suggested Japan is considering measures to cut short- to medium-term yields, while lifting those of long-term bonds.
Traditionally, September tends to be a month of lower returns for stocks, and traders said this year could be no exception given the abundance of uncertainties including the rate outlook and November's U.S. election.
"With worries about growth and what the Fed is going to do about rate hikes... It could be the start of a little bit of a pullback," especially after recent record high combined with low volatility, said Giri Cherukuri, head trader at OakBrook Investments LLC in Lisle, Illinois.
North Korea conducted its fifth and biggest nuclear test on Friday and said it had mastered the ability to mount a warhead on a ballistic missile, drawing condemnation from the United States as well as China, Pyongyang's main ally.
Further pressure on the U.S. equity market came after Boston Fed President Eric Rosengren, a historically dovish policymaker, said the U.S. central bank faced increasing risks if it waited too much longer to raise interest rates.
He said a gradual monetary policy tightening was likely appropriate, although he added the Fed was unlikely to raise rates too rapidly.
The Dow Jones industrial average (DJI) was down 394.46 points, or 2.13 percent, to 18,085.45, while the S&P 500 (SPX) lost 53.49 points, or 2.45 percent, to 2,127.81. This was the S&P's biggest one-day percentage decline since June 24, the day after Britain's vote to leave the European Union.
The Nasdaq Composite (IXIC) dropped 133.58 points, or 2.54 percent, to 5,125.91.
Stocks also fell for the week, with the Dow down 2.2 percent, its biggest weekly percentage drop since the first week of 2016.
U.S. stocks have been subdued for two months, with the benchmark S&P 500 index failing to register a move of more than 1 percent on a closing basis in either direction since July 8.
The Fed holds its two-day policy meeting on Sept. 20-21. The perceived chances of a September rate hike climbed to 24 percent in the wake of the Fed comments, according to CME's FedWatch tool, from 18 percent the previous day.
"There are lots of reasons for people to get nervous, particularly with the market at all-time highs. There's enough negative to tip things over to people taking some profits there," said Eric Kuby, chief investment officer at North Star Investment Management Corp. in Chicago.
Kroger's (N:KR) was the latest grocer to give a disappointing outlook, though its shares pared losses late in the session to end up 0.6 percent. Outlooks from Sprouts Farmers Market Inc (O:SFM) and SuperValu Inc (N:SVU) earlier this week also disappointed investors.
Utilities (SPLRCU) were down 3.8 percent and telecoms (SPLRCL) down more than 3.4 percent, the worst performing of the 10 major S&P sectors. The sectors have been strong performers on the year as investors have used their high dividends as a bond proxy.
Declining issues outnumbered advancing ones on the NYSE by a 19.30-to-1 ratio; on Nasdaq, a 6.16-to-1 ratio favored decliners.
The S&P 500 posted 4 new 52-week highs and 3 new lows; the Nasdaq Composite recorded 43 new highs and 35 new lows.

Volume was much higher than average. About 8.5 billion shares changed hands on U.S. exchanges, compared with the 6.1 billion daily average for the past 20 trading days, according to Thomson Reuters data.