The government shutdown is now the longest in history and it is delaying economic reports traders rely on as fundamental gauges on the economy, says Don Kaufman.
On Friday, New York Fed President John Williams (NYSE:WMB) stated the shutdown could cut economic growth by 1%. That would cut growth by about half.
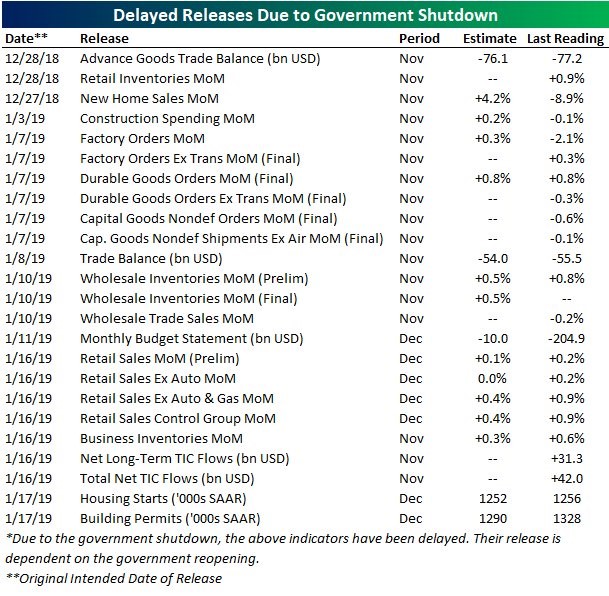
The table below shows the list of economic reports that haven’t come out because of the government shutdown. This is in addition to the Commodity Futures Trading Commission’s Commitments of Traders (COT) Report and numerous U.S. Department of Agriculture reports. The Q4 GDP estimates could be off by more than usual because the economic reports from November and December have been delayed. We will find out if they are correct in the next few weeks once the government shutdown is over. It’s possible that most Q4 GDP estimates are so close because the data from November and December hasn’t been released yet. I was mistaken to express as much confidence in the Q4 GDP estimates as I did in a previous article. These delays explain why I am so confused by the rally in stocks. How can you buy stocks when they are up so much in the past couple weeks and you don’t know how the economy is doing?
Great industrial production report
In the midst of this economic wilderness, we received a great December Industrial Production report.
As you can see from the chart below, the hard industrial production manufacturing report showed improvement while the soft ISM manufacturing report showed slowing growth. Hard data is much more important than soft data, so this is great news.
Specifically, industrial production was up 0.3% month-over-month and 4% year-over-year. This met expectations on a monthly basis. However, the monthly comp got easier because growth was revised from 0.6% to 0.4% in November.
This report seems to have verified the stock market rally this year. Obviously, it’s only one report, but it is important enough to nullify all the weak soft data manufacturing surveys from December.
Manufacturing was up an amazing 1.1% month-over-month, which was the fastest growth since February 2018. That’s better than the consensus of 0.1% and last month’s 0.1% growth. Year-over-year growth was 3.2%. Finally, capacity to utilization increased from 78.6% to 78.7%.
Because of this great report, it is now inching closer to the cycle high, which was 79.6%.
When you dig into the details, this report was even better than it seems. Headline growth was strong even though utility production was down 6.3% because of warm weather. Mining production was up 1.5%. This positive report was driven by vehicle production, construction supplies and business equipment which were up 4.7%, 1.6%, and 0.5% respectively. Consumer goods were weak as monthly growth was flat and yearly growth was only 1%.
On a year-over-year basis, vehicle production, business equipment, construction supplies, mining and utilities growth were 7.8%, 5%, 2.1%, 13.4%, and -4.3% respectively.