By Noel Randewich and Stephen Culp
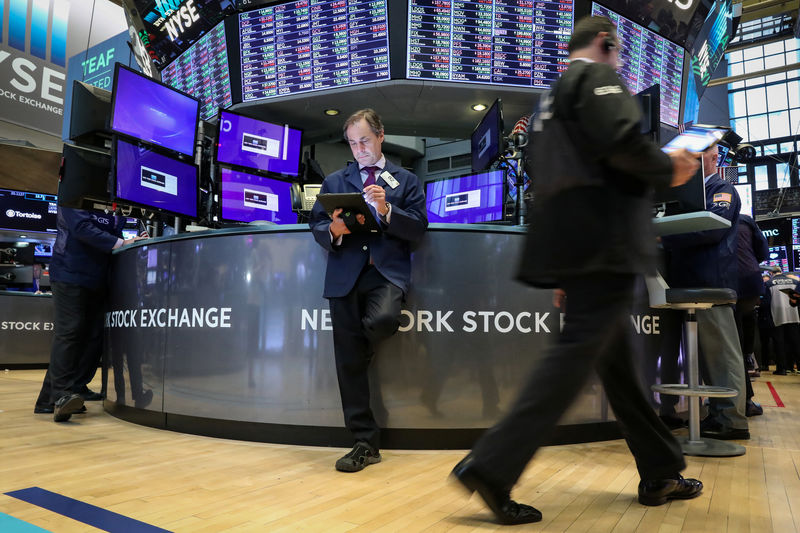
(Reuters) - Wall Street set a record high on Tuesday, confirming that a decade-old bull market is still kicking following a slump late last year, even as corporate earnings stagnate and the U.S.-China trade dispute drags on.
The widely followed S&P 500 marked its highest ever close, beating its previous record closing high on Sept. 20, and the Nasdaq beat its Aug. 29 all-time closing high.
The S&P 500 has rallied 25% from Dec. 24, reversing a steep selloff caused by fears of higher interest rates and uncertainty around U.S. President Donald Trump's trade war with Beijing. Dec. 24 marked the bottom of last year's selloff.
The S&P 500 has slightly underperformed European stocks over the same time period.
(Graphic: S&P 500 vs. world indices Image link: https://tmsnrt.rs/2W3escq).
But as the S&P 500 has recovered, corporate earnings growth has slowed, and even shrunk, following a surge last year on the back of deep U.S.corporate tax cuts. Analysts on average expect earnings per share for the quarter to fall 1.3% year over year, according to I/B/E/S data from Refinitiv.
(Graphic: Q1 earnings expectations link: https://tmsnrt.rs/2W65kUo).
While expectations for first-quarter EPS have improved over the past three weeks, forecasts for full 2019 EPS growth have become less optimistic, now at 3.0% growth, down from 3.3% at the start of the month. That is partly due to uncertainty related to global trade.
(Graphic: S&P 500 2019 earnings expectations link: https://tmsnrt.rs/2W4aRe7).
Higher stock prices and expectations for slower earnings growth have pushed forward price/earnings multiples back up to the levels that worried some investors the last time Wall Street peaked. The S&P 500's forward PE stands at almost 17, up from 14 at the start of the year, according to Datastream.
(Graphic: S&P 500 forward P/E Image link: https://tmsnrt.rs/2W1xtvZ).
Since the S&P 500's September high, utilities have been the top performing S&P sector, up 9%, followed by consumer services and real estate, both up 7%.
(Graphic: S&P 500 sectors link: https://tmsnrt.rs/2IEn0Ue).
Buoyed by bets about the upcoming rollout of 5G telecommunications infrastructure, chipmaker Xilinx (NASDAQ:XLNX) has been the top-performing S&P 500 stock since Sept. 20, up 74%, while CenturyLink's 47% loss has made the telecoms service provider the worst performer.
(Graphic: S&P 500 top performers link: https://tmsnrt.rs/2ICbNDo).
(Graphic: S&P 500 bottom performers link: https://tmsnrt.rs/2IzHFZz).
Among the top 10 performers since Sept. 20, only Twitter has a forward PE that has declined during that time.
(Graphic: Forward PEs of top S&P 500 stocks link: https://tmsnrt.rs/2W0QfUd).
With the Federal Reserve widely viewed as "on pause" after hiking interest rate four times last year, the 10-year U.S. Treasury yield has dropped to 2.6% from highs of over 3.2% last November.
(Graphic: S&P 500 and 10-year Treasury yield Image link: https://tmsnrt.rs/2W4gLfh).
