By Stephen Culp
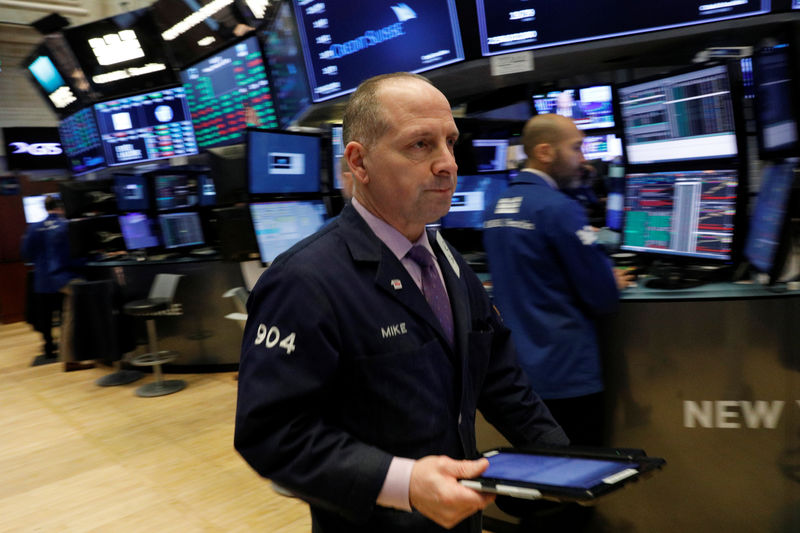
NEW YORK (Reuters) - Worries about the impact of a tightening job market on the prospects for inflation and a surge in bond yields sent investors fleeing equities on Friday, with the Dow Jones Industrials Average swooning almost 666 points, for its biggest daily percentage loss in 20 months.
It was the biggest daily point fall in the Dow since December 2008 during the financial crisis.
With Friday's rout, Wall Street's three major indexes logged their biggest weekly losses in two years, after closing at record highs the previous week. The S&P 500 and Dow saw their worst weeks since early January 2016 while Nasdaq had its worst week since early Feb 2016.
"People are starting to really get increasingly uncomfortable with the rapid rise in interest rates that we have seen and the uncertainty of how that is actually going to start to play out relative to competition for stocks," said Chuck Carlson, chief executive officer at Horizon Investment Services in Hammond, Indiana.
Overnight stock price losses accelerated after the U.S. Labor Department reported employment grew more than expected in January with the biggest wage gain in more than 8-1/2 years. The picture of workers commanding higher salaries fueled expectations that inflation is on the rise, which could prompt the Federal Reserve to take a more aggressive approach to rate hikes this year.
That caused the 10-year Treasury yield to surge to 2.8450 percent the highest since Jan. 2014, which could make returns on Treasuries look more attractive relative to stocks.
But market players are not convinced that the bull market in stocks that that saw the S&P 500 rise 5.6 percent in January is over. In fact many say a pull back was overdue.
"You have a jobs report today that was pretty robust all kind of feeding into the higher interest rates, greater inflation story, and I think the markets are trying to grapple with that right now," said Carlson.
The Dow Jones Industrial Average (DJI) fell 665.75 points, or 2.54 percent, to 25,520.96, the S&P 500 (SPX) lost 59.85 points, or 2.12 percent, to 2,762.13 and the Nasdaq Composite (IXIC) dropped 144.92 points, or 1.96 percent, to 7,240.95.
S&P 500 e-mini stock futures
All 11 major sectors of the S&P 500 closed down. Technology (SPLRCT) weighed the heaviest, with Microsoft (O:MSFT) pulling the sector down 3.0 percent.
The CBOE Volatility Index (VIX), the most widely followed barometer of expected near-term volatility for the S&P 500 Index rose more than four points to 17.86, its highest since November 2016. VIX options trading volume hit a record high.
Analysts now see fourth-quarter earnings growth of 13.6 percent for the S&P 500, up from 12 percent on January 1. Half of the index's companies have reported, 78 percent of which beat Street expectations, according to Thomson Reuters data.
Exxon Mobil Corp (N:XOM) and Chevron Corp (N:CVX) shares were down 5.1 percent and 5.6 percent, respectively, after the oil companies posted lower-than-expected fourth-quarter profit.
Alphabet (O:GOOGL) fell 5.3 percent after the Google parent's fourth-quarter profit came in below consensus on increased spending.
Apple (O:AAPL) shares were off by 4.3 percent as investors worried about the iPhone maker's weak outlook amid reports of scaled back iPhone X production.
Amazon.com (O:AMZN) was a bright spot, up 2.9 percent as Wall Street analysts quickly upped their price targets following the online retailer's impressive earnings report.
Declining issues outnumbered advancing ones on the NYSE by a 7.70-to-1 ratio; on Nasdaq, a 3.90-to-1 ratio favored decliners.
The S&P 500 posted 18 new 52-week highs and 18 new lows; the Nasdaq Composite recorded 48 new highs and 103 new lows.

Volume on U.S. exchanges was 5.39 billion shares, compared to the 7.33 billion average for the full session over the last 20 trading days.