Get 40% Off
⚠ Earnings Alert! Which stocks are poised to surge?
See the stocks on our ProPicks radar. These strategies gained 19.7% year-to-date.
Unlock full list

Global money market funds draw massive inflows in week to March 15

Published 03/17/2023, 06:52 AM
Updated 03/17/2023, 06:55 AM
© Reuters. A woman walks past an electronic board showing world benchmarks outside a brokerage, in Tokyo, Japan, March 17, 2023. REUTERS/Androniki Christodoulou

(Reuters) - Global money market and government bond funds obtained massive weekly inflows as investors rushed to safer assets on fears of contagion from the collapse of three U.S. banks last week.

The turmoil triggered outflows from riskier equity funds, although sentiment improved on Thursday after large U.S. banks injected funds into San Francisco-based First Republic Bank (NYSE:FRC), and Swiss bank Credit Suisse clinched an emergency central bank loan.

Global money market funds drew $112.13 billion in the week to March 15, data from Refinitiv Lipper showed. Government bond funds received $8.22 billion during the period, the biggest weekly inflow since July 13, 2022.

(Graphic: Fund flows: Global equities, bonds and money market - https://fingfx.thomsonreuters.com/gfx/mkt/lgvdkjkdapo/Fund%20flows-%20Global%20equities%20bonds%20and%20money%20market.jpg)

Investors pulled out $19.2 billion from global equity funds, in their biggest weekly net selling since the third week of December.

The U.S., European and Asian equity funds all witnessed withdrawals, amounting to a net $17.22 billion, $3.31 billion and $270 million, respectively.

Among equity sector funds, healthcare, industrials and metals & mining suffered $645 million, $613 million and $258 million worth of net selling, respectively. Consumer discretionary, however, obtained a net $507 million inflow.

(Graphic: Fund flows: Global equity sector funds - https://fingfx.thomsonreuters.com/gfx/mkt/egpbyjyrbvq/Fund%20flows-%20Global%20equity%20sector%20funds.jpg)

Global bond funds recorded their first weekly outflow in 11 weeks, amounting a net $5.15 billion, with high-yield funds witnessing $2.51 billion worth of net disposals.

(Graphic: Global bond fund flows in the week ended March 15 - https://fingfx.thomsonreuters.com/gfx/mkt/dwvkdkdxnpm/Global%20bond%20fund%20flows%20in%20the%20week%20ended%20March%2015.jpg)

Among commodity funds, precious metal funds obtained about $250 million, the biggest weekly inflow in seven weeks, while energy funds saw marginal outflow of $33 million.
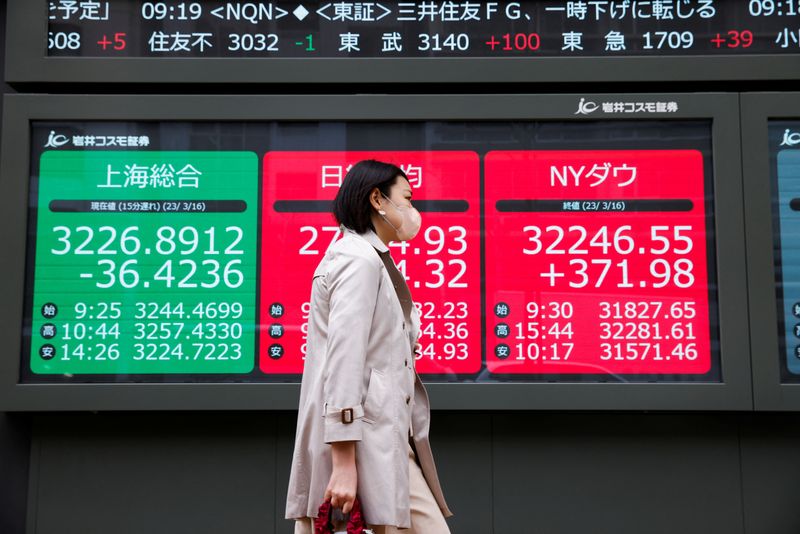
© Reuters. A woman walks past an electronic board showing world benchmarks outside a brokerage, in Tokyo, Japan, March 17, 2023. REUTERS/Androniki Christodoulou

Data for 23,846 emerging market funds showed investors exited $1.23 billion worth of bond funds, and withdrew $1.37 billion out of equity funds after nine weeks of net purchases in a row.

(Graphic: Fund flows: EM equities and bonds - https://fingfx.thomsonreuters.com/gfx/mkt/klpygqgalpg/Fund%20flows-%20EM%20equities%20and%20bonds.jpg)

Latest comments

Risk Disclosure: Trading in financial instruments and/or cryptocurrencies involves high risks including the risk of losing some, or all, of your investment amount, and may not be suitable for all investors. Prices of cryptocurrencies are extremely volatile and may be affected by external factors such as financial, regulatory or political events. Trading on margin increases the financial risks.
Before deciding to trade in financial instrument or cryptocurrencies you should be fully informed of the risks and costs associated with trading the financial markets, carefully consider your investment objectives, level of experience, and risk appetite, and seek professional advice where needed.
Fusion Media would like to remind you that the data contained in this website is not necessarily real-time nor accurate. The data and prices on the website are not necessarily provided by any market or exchange, but may be provided by market makers, and so prices may not be accurate and may differ from the actual price at any given market, meaning prices are indicative and not appropriate for trading purposes. Fusion Media and any provider of the data contained in this website will not accept liability for any loss or damage as a result of your trading, or your reliance on the information contained within this website.
It is prohibited to use, store, reproduce, display, modify, transmit or distribute the data contained in this website without the explicit prior written permission of Fusion Media and/or the data provider. All intellectual property rights are reserved by the providers and/or the exchange providing the data contained in this website.
Fusion Media may be compensated by the advertisers that appear on the website, based on your interaction with the advertisements or advertisers.
© 2007-2024 - Fusion Media Limited. All Rights Reserved.