By Caroline Valetkevitch
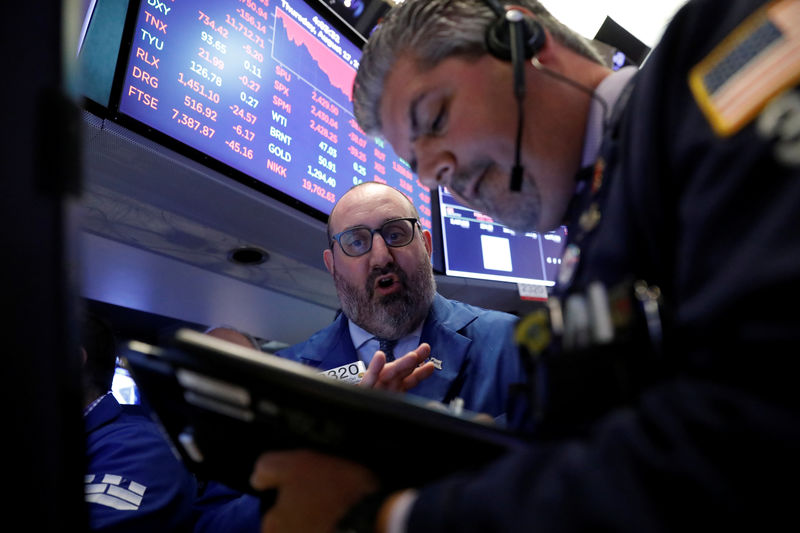
NEW YORK (Reuters) - U.S. stocks sold off on Thursday, with the S&P 500 recording its biggest daily percentage drop in three months as escalating worries about the Trump administration's ability to push through its economic agenda rattled investors.
The benchmark index also closed at its lowest since July 11, with the day's move marking the first time since the Nov. 8 election of two days with more than 1 percent declines so close together. The index dropped 1.4 percent last Thursday, as concern over a possible conflict between the United States and North Korea hit the market.
The falls mark a break from a period of low volatility and subdued moves. The S&P 500 has had just four 1 percent declines this year.
Investors appeared to be losing faith in the Trump administration's ability to move forward with tax cuts and the rest of its domestic economic agenda, some strategists said. The latest cause for concern was speculation over the possible departure of National Economic Council Director Gary Cohn.
"You've elected a Republican administration which should be good news for the market, good news for business, and they're getting precious little done. And you had a big rally based on that," said Stephen Massocca, senior vice president at Wedbush Securities in San Francisco.
With valuation levels considered high in many stocks, investors may be more prone to sell. "Anything can be an excuse," he said.
Stocks rallied sharply after the election of Donald Trump as president, and even with the day's losses, the S&P 500 is up 13.6 percent since Nov. 8. The index is trading at 17.8 times forward earnings, well above its long-term average of 15, Thomson Reuters data shows.
The market was also on edge after a van crashed into dozens of people in the center of Barcelona killing at least 13 people in an attack claimed by Islamic State.
The Dow Jones Industrial Average (DJI) ended down 274.14 points, or 1.24 percent, to 21,750.73, the S&P 500 (SPX) lost 38.1 points, or 1.54 percent, to 2,430.01 and the Nasdaq Composite (IXIC) dropped 123.20 points, or 1.94 percent, to 6,221.91.
Stocks began to lose ground early in the session, following the speculation about Cohn.
A White House official later said Cohn intends to remain in his position. After a short respite, the market continued to sell off and picked up the pace into the close. All 30 Dow stocks fell, along with all components of the S&P 100 <.OEXA>.
On Wednesday, Trump disbanded two business councils, with several chief executives quitting in protest over his remarks on white nationalists.
Late on Thursday, the White House said Trump has abandoned plans to create an infrastructure advisory council. S&P e-mini futures
The U.S. stock market has not followed a 1 percent down day with a second straight day of losses since Trump was elected, so Friday's session could serve as a significant test of the market's resilience.
The S&P also was on pace for its worst back-to-back weeks since the election.
Disappointing corporate results weighed as well. Shares of Dow component Cisco Systems (O:CSCO) fell 4 percent a day after its results, while Wal-Mart (N:WMT) was down 1.6 percent after the retailer reported a drop in margins due to continued price cuts and e-commerce investments.
Small-cap stocks also sold off. The Russell 2000 index (RUT), a widely used gauge of small caps, closed below its 200-day moving average for the first time since June 2016.
Declining issues outnumbered advancing ones on the NYSE by a 4.55-to-1 ratio; on Nasdaq, a 3.89-to-1 ratio favored decliners.
It was also the seventh straight day in which the NYSE and Nasdaq had more stocks making new 52-week lows than highs, the longest stretch since Trump's election.

About 6.7 billion shares changed hands on U.S. exchanges. That compares with the 6.3 billion daily average for the past 20 trading days, according to Thomson Reuters data.