Get 40% Off
🚨 Volatile Markets? Find Hidden Gems for Serious OutperformanceFind Stocks Now

How big U.S. banks have managed bad loan reserves since the pandemic

Published 07/11/2022, 06:05 AM
Updated 07/11/2022, 06:32 AM
© Reuters. FILE PHOTO: People pass the JP Morgan Chase & Co. Corporate headquarters in the Manhattan borough of New York City, May 20, 2015.REUTERS/Mike Segar/

(Reuters) -The big six U.S. banks face a tough second quarter earnings season due to a hit from increased loan loss reserves, as the pandemic recovery gives way to a possible recession.

Though consumer spending trends remain strong, the looming threat of a recession and soaring inflation are expected to test the strength of U.S. consumers and companies.

Below is an outline of how banks have managed their reserves since 2020, when the COVID-19 pandemic forced them to set aside billions of dollars to account for potential loan losses, most of which did not materalize thanks to government stimulus packages.

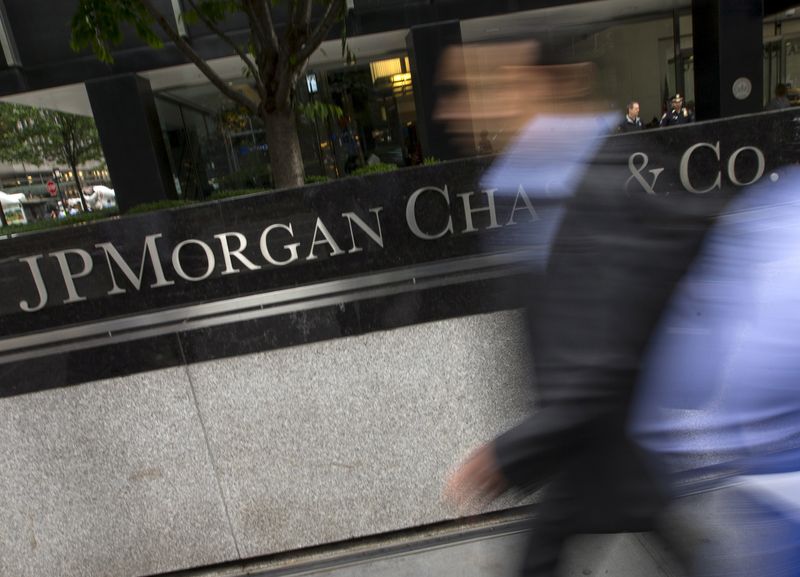
JPMorgan Chase & Co (NYSE:JPM)

Quarter Reserves/p Reserves/p

rovisions rovisions

released built

Q1 2022 $902

million

Q4 2021 $1.8 -

billion

Q3 2021 $2.1 -

billion

Q2 2021 $3 billion -

Q1 2021 $5.2 -

billion

Q4 2020 $2.9 -

billion

Q3 2020 $569 -

million

Q2 2020 - $8.9

billion

Q1 2020 - $6.8

billion

Bank of America Corp (NYSE:BAC)

Quarter Reserves/p Reserves/p

rovisions rovisions

released built

Q1 2022 $362 -

million

Q4 2021 $851 -

million

Q3 2021 $1.1 -

billion

Q2 2021 $2.2 -

billion

Q1 2021 $2.7 -

billion

Q4 2020 $828 -

million

Q3 2020 - $417

million

Q2 2020 - $4 billion

Q1 2020 - $3.6

3rd party Ad. Not an offer or recommendation by Investing.com. See disclosure here or remove ads .

billion

Goldman Sachs Group Inc (NYSE:GS)

Quarter Reserves/p Reserves/p

rovisions rovisions

released built

Q1 2022 - $561

million

Q4 2021 - $344

million

Q3 2021 - $175

million

Q2 2021 $92 -

million

Q1 2021 $70 -

million

Q4 2020 - $293

million

Q3 2020 - $278

million

Q2 2020 - $1.6

billion

Q1 2020 - $937

million

Citigroup Inc (NYSE:C)

Quarter Reserves/p Reserves/p

rovisions rovisions

released built

Q1 2022 $138 -

million

Q4 2021 $1.4 -

billion

Q3 2021 $1.2 -

billion

Q2 2021 $2.4 -

billion

Q1 2021 $3.9 -

billion

Q4 2020 $1.5 -

billion

Q3 2020 - $436

million

Q2 2020 - $5.6

billion

Q1 2020 - $4.9

billion

Wells Fargo (NYSE:WFC) & Co

Quarter Reserves/p Reserves/p

rovisions rovisions

released built

Q1 2022 $787 -

million

Q4 2021 $452 -

million

Q3 2021 $1.4 -

billion

Q2 2021 $1.26 -

billion

Q1 2021 $1.05 -

billion

Q4 2020 $179 -

million

Q3 2020 - $769

million

Q2 2020 - $9.5

billion

Q1 2020 - $4 billion

Morgan Stanley (NYSE:MS)

Quarter Reserves/p Reserves/p

rovisions rovisions

3rd party Ad. Not an offer or recommendation by Investing.com. See disclosure here or remove ads .

released built

Q1 2022 - $57

million

Q4 2021 - $5 million

Q3 2021 - $24

million

Q2 2021 - $73

million

Q1 2021 $98 -

million

Q4 2020 - $4 million

Q3 2020 - $111

million

Q2 2020 - $239

million

Q1 2020 - $407

million

Latest comments

Just maybe with there leverage through BD's they'll get there? Time will tell.
Risk Disclosure: Trading in financial instruments and/or cryptocurrencies involves high risks including the risk of losing some, or all, of your investment amount, and may not be suitable for all investors. Prices of cryptocurrencies are extremely volatile and may be affected by external factors such as financial, regulatory or political events. Trading on margin increases the financial risks.
Before deciding to trade in financial instrument or cryptocurrencies you should be fully informed of the risks and costs associated with trading the financial markets, carefully consider your investment objectives, level of experience, and risk appetite, and seek professional advice where needed.
Fusion Media would like to remind you that the data contained in this website is not necessarily real-time nor accurate. The data and prices on the website are not necessarily provided by any market or exchange, but may be provided by market makers, and so prices may not be accurate and may differ from the actual price at any given market, meaning prices are indicative and not appropriate for trading purposes. Fusion Media and any provider of the data contained in this website will not accept liability for any loss or damage as a result of your trading, or your reliance on the information contained within this website.
It is prohibited to use, store, reproduce, display, modify, transmit or distribute the data contained in this website without the explicit prior written permission of Fusion Media and/or the data provider. All intellectual property rights are reserved by the providers and/or the exchange providing the data contained in this website.
Fusion Media may be compensated by the advertisers that appear on the website, based on your interaction with the advertisements or advertisers.
© 2007-2024 - Fusion Media Limited. All Rights Reserved.