The QuantCycle indicator shows several markets including BAC in extreme territory on the oscillator, notes John Rawlins.
Normally we bring you the most compelling short- to medium-term QuantCycle charts on a weekly basis to highlight markets that appear to be near a turning point, or exhibiting extreme overbought/oversold characteristics. However, a couple of charts caught our attention, and we decided to share them immediately.
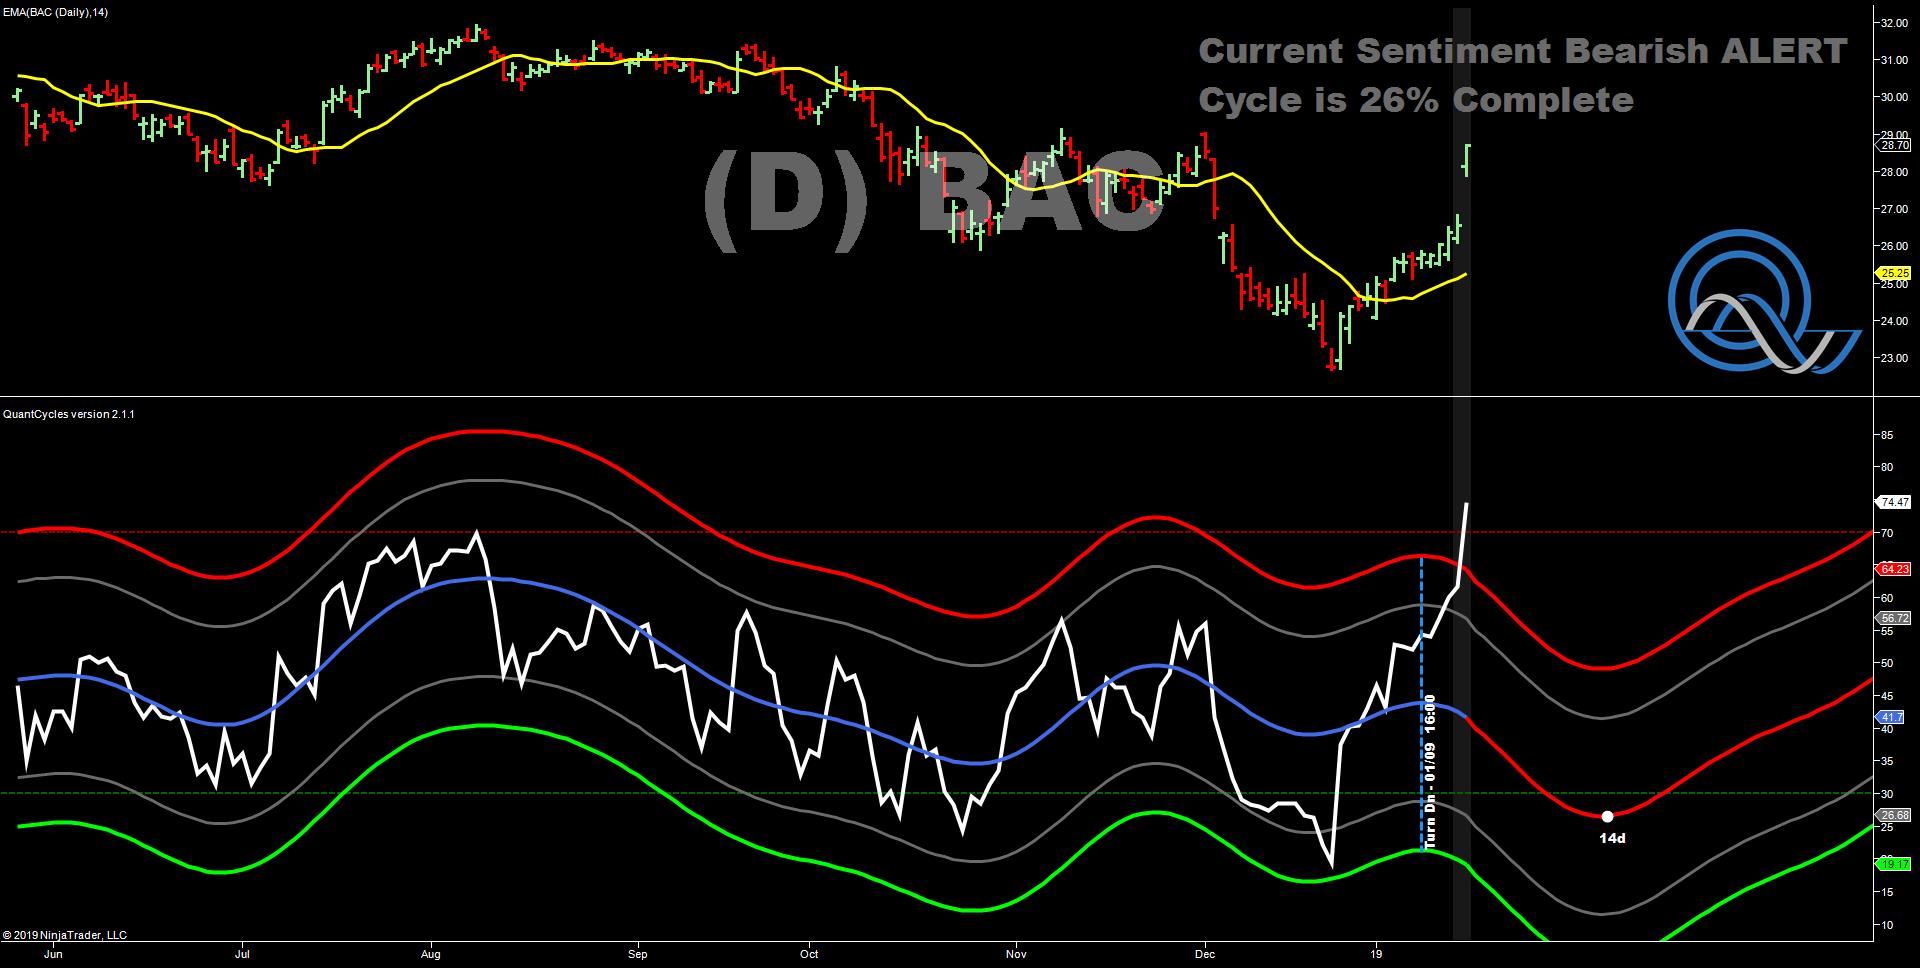
Bank of America (NYSE:BAC)
A strong fourth quarter earnings report caused Bank of America (BAC) stock to spike 7% on Wednesday. BAC had already staged a strong rally in the first two-weeks of 2019 after setting a 15-month low on Dec. 21. This rally had already put BAC close to overbought territory on the QuantCycle daily chart just as the QuantCycle had BAC turning lower. The Jan. 16 spike blew through overbought territory and the oscillator suggests that BAC could test the Dec. 21 low in the month.
EURGBP (EUR/GBP)
The EUR/GBP pair touched oversold territory on the daily QuantCycle chart just as the oscillator is turning higher.
Silver has already drifted off its early 2019 highs, but it still appears close to overbought territory and the QuantCycle anticipates a sharp sell-off over the next two weeks that could challenge November lows. This would be a $2 move in less than two weeks! While the weekly chart (second chart) is not as bearish, it does show silver in overbought territory.
Mexican Peso (USD/MXN)
The Mexican peso has been gaining ground on the U.S. dollar (forex chart shows decline, meaning peso is gaining value) steadily since December. This has put it in solid oversold territory on the QuantCycle daily chart despite the QuantCycle indicating a reversal around the first of the year. This is an extremely strong signal for the next seven trading days.
The QuantCycle indicator is a technical tool that employs proprietary statistical techniques and complex algorithms to filter multiple cycles from historical data, combines them to obtain cyclical information from price data and then gives a graphical representation of their predictive behavior (center line forecast). Other proprietary frequency techniques are then employed to obtain the cycles embedded in the prices. The upper and lower bands of the oscillator represent a two-standard deviation move from the predictive price band and are indicative of extreme overbought/oversold conditions.