By Scott DiSavino
(Reuters) - U.S. energy firms added oil rigs for a second week in a row as crude prices, which have dropped about 15% this year, were set to rise this week as investor concerns began to ease over the long-term economic impact of the coronavirus.
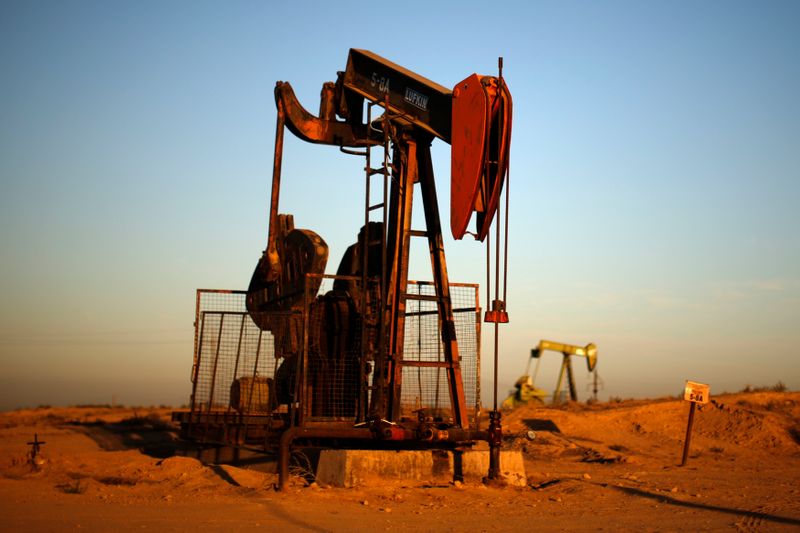
Companies added two oil rigs in the week to Feb. 14, bringing the total count to 678, energy services firm Baker Hughes Co (N:BRK) said in its closely followed report on Friday.
In the same week a year ago, there were 857 active rigs.
"Rig activity is biased to the downside in this weak and uncertain price environment," said James Williams (NYSE:WMB) of WTRG Economics in Arkansas, noting "It is likely both oil and (natural) gas production will peak in the first half of the year."
U.S. crude futures (CLc1) traded around below $52 per barrel on Friday, putting the front-month on track to rise for the first time in six weeks. [O/R]
Looking ahead, U.S. crude futures were trading around $52 a barrel for the balance of 2020 and $51 for calendar 2021 . That compares with an average of $57.04 in 2019.
The oil rig count, an early indicator of future output, dropped by an average of 208 rigs in 2019 after rising 138 rigs in 2018 as independent exploration and production (E&P) companies cut spending on new drilling in response to investor demands to improve financial returns in a low energy price environment. [nL2N27V0EQ]
The Energy Information Administration this week cut its growth outlook, forecasting U.S. crude production will rise by 960,000 barrels per day (bpd) in 2020 to a record of 13.2 million bpd, below its previous forecast for a rise of 1.06 million bpd. [EIA/M]
Occidental Corp (N:OXY) on Tuesday further cut its spending to between $5.2 billion and $5.4 billion, $100 million below its earlier forecast, but the shale producer told investors it would produce more oil and gas this year even with lower spending. [nL4N2AB2Z7][nL1N29E00M]
U.S. financial services firm Cowen & Co said 27 of the independent E&Ps it watches reported spending estimates for 2020, implying a 13% year-over-year decline in 2020.
Year-to-date, the total number of oil and gas rigs active in the United States has averaged 791. Most rigs produce both oil and gas.
Analysts at Simmons Energy, energy specialists at U.S. investment bank Piper Sandler, have forecast the annual average combined oil and gas rig count will slide from 943 in 2019 to 816 in 2020 before rising to 848 in 2021.
That is the same as Simmons forecasts since early January and means Simmons expects the weekly rig count will rise from its current level later in the year.