Breaking News
Investing Pro 0
Free Webinar - Decode the market's secrets! | Tuesday, May 30, 2023 | 01:00PM EDT Enroll Now

U.S. drillers add oil rigs for first week in three: Baker Hughes

Published Dec 21, 2018 02:37PM ET
Saved. See Saved Items.
This article has already been saved in your Saved Items
 
© Reuters. FILE PHOTO: A drilling rig on a lease owned by Oasis Petroleum performs logging operations in the Permian Basin near Wink
 
GE
+1.20%
Add to/Remove from Watchlist
Add to Watchlist
Add Position

Position added successfully to:

Please name your holdings portfolio
 
CL
-1.16%
Add to/Remove from Watchlist
Add to Watchlist
Add Position

Position added successfully to:

Please name your holdings portfolio
 
NG
-2.40%
Add to/Remove from Watchlist
Add to Watchlist
Add Position

Position added successfully to:

Please name your holdings portfolio
 

(Reuters) - U.S. energy firms added oil rigs for the first time in the past three weeks despite sharp declines in crude futures prices to their lowest since the summer of 2017.

Drillers added 10 oil rigs in the week to Dec. 21, bringing the total count to 883, General Electric Co's (N:GE) Baker Hughes energy services firm said in its closely followed report on Friday. . This was the biggest weekly gain in rig numbers since early November.

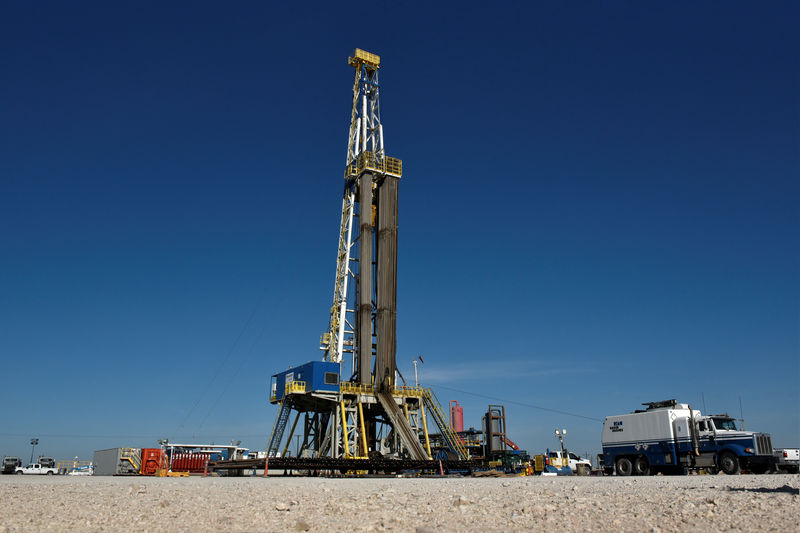
More than half the total U.S. oil rigs are in the Permian Basin, the country's biggest shale oil formation. Active units there held steady this week at 486, the lowest since early October.

Drillers added 2 rigs in the Niobrara shale in Colorado and Wyoming, bringing the total there up to 30, the most since Sept. 2017, and three rigs in Williston in North Dakota and Montana, bringing the total up to 56.

The U.S. rig count, an early indicator of future output, is higher than a year ago when 747 rigs were active as energy companies have spent more to capture higher prices.

U.S. crude futures (CLc1) were trading around $46 a barrel on Friday, down about 10 percent for the week, as global oversupply kept buyers away from the market ahead of the end of year holidays. Earlier Friday, the contract fell to its lowest since July 2017. [O/R]

Crude futures were trading around $49 a barrel for calendar 2019 and $50 for calendar 2020 .

U.S. financial services firm Cowen & Co this week said the exploration and production (E&P) companies it tracks have provided guidance indicating a 23 percent increase this year in planned capital spending.

Cowen said the E&Ps it tracks expect to spend a total of $88.9 billion in 2018. That compares with projected spending of $72.2 billion in 2017. Cowen said early 2019 capital spending budgets were mixed.

Analysts at Simmons & Co, energy specialists at U.S. investment bank Piper Jaffray, this week forecast the average combined oil and natural gas rig count would rise from 876 in 2017 to 1,031 in 2018, 1,092 in 2019 and 1,227 in 2020.

Year-to-date, the total number of oil and gas rigs active in the United States has averaged 1,031. That keeps the total count for 2018 on track for the highest since 2014, which averaged 1,862 rigs. Most rigs produce both oil and gas.

U.S. drillers add oil rigs for first week in three: Baker Hughes
 

Related Articles

Add a Comment

Comment Guidelines

We encourage you to use comments to engage with other users, share your perspective and ask questions of authors and each other. However, in order to maintain the high level of discourse we’ve all come to value and expect, please keep the following criteria in mind:  

  •            Enrich the conversation, don’t trash it.

  •           Stay focused and on track. Only post material that’s relevant to the topic being discussed. 

  •           Be respectful. Even negative opinions can be framed positively and diplomatically. Avoid profanity, slander or personal attacks directed at an author or another user. Racism, sexism and other forms of discrimination will not be tolerated.

  • Use standard writing style. Include punctuation and upper and lower cases. Comments that are written in all caps and contain excessive use of symbols will be removed.
  • NOTE: Spam and/or promotional messages and comments containing links will be removed. Phone numbers, email addresses, links to personal or business websites, Skype/Telegram/WhatsApp etc. addresses (including links to groups) will also be removed; self-promotional material or business-related solicitations or PR (ie, contact me for signals/advice etc.), and/or any other comment that contains personal contact specifcs or advertising will be removed as well. In addition, any of the above-mentioned violations may result in suspension of your account.
  • Doxxing. We do not allow any sharing of private or personal contact or other information about any individual or organization. This will result in immediate suspension of the commentor and his or her account.
  • Don’t monopolize the conversation. We appreciate passion and conviction, but we also strongly believe in giving everyone a chance to air their point of view. Therefore, in addition to civil interaction, we expect commenters to offer their opinions succinctly and thoughtfully, but not so repeatedly that others are annoyed or offended. If we receive complaints about individuals who take over a thread or forum, we reserve the right to ban them from the site, without recourse.
  • Only English comments will be allowed.
  • Any comment you publish, together with your investing.com profile, will be public on investing.com and may be indexed and available through third party search engines, such as Google.

Perpetrators of spam or abuse will be deleted from the site and prohibited from future registration at Investing.com’s discretion.

Write your thoughts here
 
Are you sure you want to delete this chart?
 
Post
Post also to:
 
Replace the attached chart with a new chart ?
1000
Your ability to comment is currently suspended due to negative user reports. Your status will be reviewed by our moderators.
Please wait a minute before you try to comment again.
Thanks for your comment. Please note that all comments are pending until approved by our moderators. It may therefore take some time before it appears on our website.
 
Are you sure you want to delete this chart?
 
Post
 
Replace the attached chart with a new chart ?
1000
Your ability to comment is currently suspended due to negative user reports. Your status will be reviewed by our moderators.
Please wait a minute before you try to comment again.
Add Chart to Comment
Confirm Block

Are you sure you want to block %USER_NAME%?

By doing so, you and %USER_NAME% will not be able to see any of each other's Investing.com's posts.

%USER_NAME% was successfully added to your Block List

Since you’ve just unblocked this person, you must wait 48 hours before renewing the block.

Report this comment

I feel that this comment is:

Comment flagged

Thank You!

Your report has been sent to our moderators for review
Continue with Google
or
Sign up with Email