- All Instrument Types
- Indices
- Equities
- ETFs
- Funds
- Commodities
- Currencies
- Crypto
- Bonds
- Certificates
Please try another search

See the stocks on our ProPicks radar. These strategies gained 19.7% year-to-date.
Technical Analysis
What Is Technical Analysis?
Technical analysis uses identifiable chart patterns and mathematical indicators, also called studies, to forecast market activity. It assumes that the collective opinion on security is quantified by the price of that security at any given time.
In technical analysis, fundamental assessments of financial entities, such as corporate earnings or government reports, are not considered. The strict application of technical analysis aims to eliminate the potential for subjective interpretation. The goal is to establish an objective assessment of a market by eliminating emotional interpretations that might cloud the trading decision process.
Basic Tools of Technical Analysis
Support and resistance levels are the basic components of technical analysis. Support levels are any prices below the current market price that might impede a market drop. Resistance levels are any prices above the current market price that might limit a rally.
The 52-week high is an example of a resistance level; the 52-week low is an example of a support level.
Technical Analysis Types
Chart pattern analysis expects market action to repeat itself when identifiable patterns recur on price charts. Types of chart patterns include classic, Elliott wave, and candlesticks.
- Classic patterns have been used for decades to identify continuation and reversal patterns, the former include pennants, flags, and triangles. The latter includes double tops, rounding tops, and head and shoulders.
- Elliott wave analysis relies on the Golden ratio of the Fibonacci series to identify 5-wave trends and 3-wave corrections.
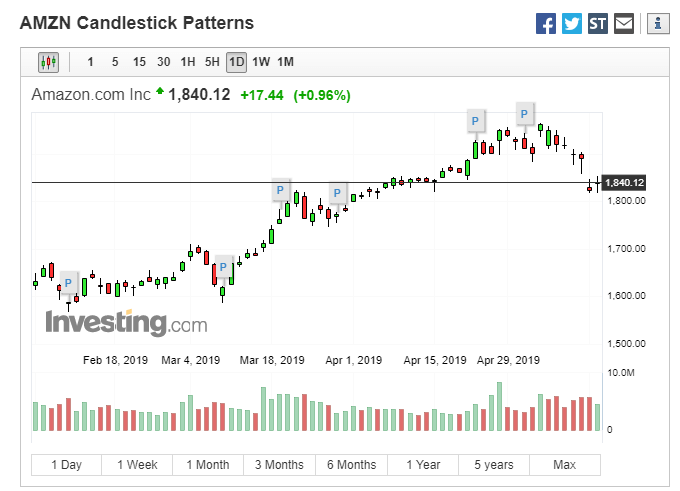
- Candlestick analysis uses the open, high, low, and close of each period, e.g. daily, weekly, etc., to identify continuation patterns like bullish long bodies or reversal patterns like hammers and shooting stars. Each type of chart pattern identifies its own set of support and resistance levels with unique implications for price activity.

Simple Moving Average
Another very basic technical indicator used by technical analysts is the simple moving average, which is the average price of the asset or security over a specific period. For example, an 8-day moving average is the average closing price of each of the past eight days.
As the name implies, the dataset moves along with time, which establishes a line on price charts that creates a signal of market strength: a bullish signal occurs when prices are above the average, a bearish signal occurs when prices are below the average.
The average itself may be support or resistance if reactions are observed when tested by the market. Additional signals occur when one average crosses another average, e.g., a bearish signal would occur when the 8-day average crosses below the 40-day average. Other forms of moving averages include weighted and exponential.
Oscillators
Oscillators are a more complicated technical indicator that rise and fall around a center line, typically zero or 50--50 if the oscillator is normalized to provide overbought and oversold readings. This category includes the Relative Strength Index (RSI), Stochastics, MACD, and momentum.
Each of these oscillators is considered bullish when rising and bearish when falling. Confirmation of a directional indication occurs when the reading pushes through the centerline. RSI and Stochastics are normalized on a scale of 0 to 100; readings above 70 are considered overbought and below 30 are considered oversold.
Trend Indicators, like Average Directional Index (ADX), are another important category. The purpose of these calculations is to identify a market that has strong directional momentum, making targets from chart patterns likely to be reached. These indicators do not identify specific levels or direction, but help analysts assess the probability of market continuation.
Finding Technical Analysis Tools on Investing.com
Many technical analysis tools are available on Investing.com, including via the Live Stocks Chart page, which can be reached by hovering over the 'Charts' tab located on the black bar at the top of every page on the site.
The interactive chart on this page includes the option to filter for many chart types, including candlesticks, bars, and point and figure. Interval choices appear at the top of the chart frame with a long list of studies available behind the button that looks like a column chart with an upsloping line above. Chart drawing options are available on the left side of the window.
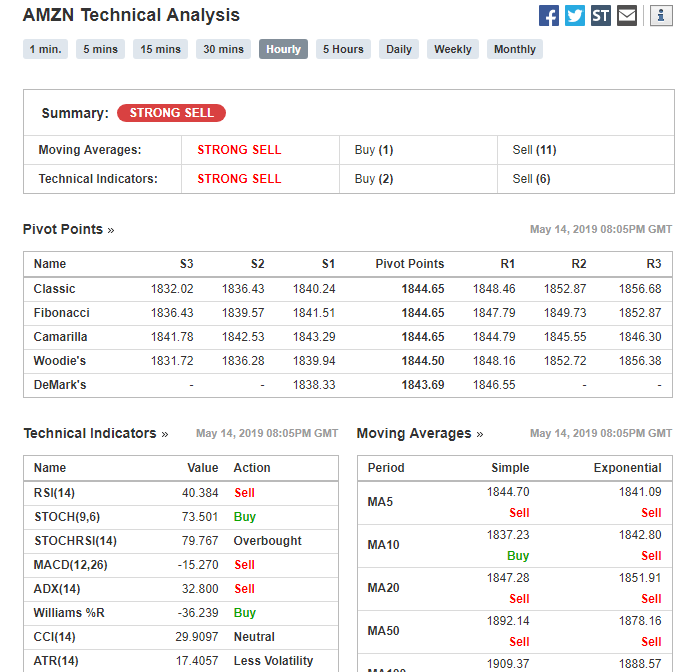
As well, there are a vast array of technical tools on the home page of each stock, e.g., Alphabet (NASDAQ:GOOGL). Scroll down the page to the Technical Summary section which includes a breakdown of major technical studies on multiple time-frames with color-coded buy and sell labels. Beneath that, candlestick patterns with directional implications are also available under the Candlestick pattern tab.


