


Sign up to create alerts for Instruments,
Economic Events and content by followed authors
Free Sign Up Already have an account? Sign In
Please try another search
The Relative Strength Index (RSI) is a momentum indicator used by technical analysts to gauge whether or not a market is overbought (bearish) or oversold (bullish). RSI was created by J. Welles Wilder in the late 1970s and is one of the most widely used technical indicators.
The RSI scale is 0 to 100. Readings above 70 are typically considered overbought, readings below 30 are considered oversold. It is generally thought that an overbought market is trading above its fair value due to excess buying, while an oversold market is trading below its fair value due to excess selling.
RSI values are most often displayed on a separate chart, above or below the price chart, as in the example below showing the close for Apple stock on Tuesday, November 13, 2018.
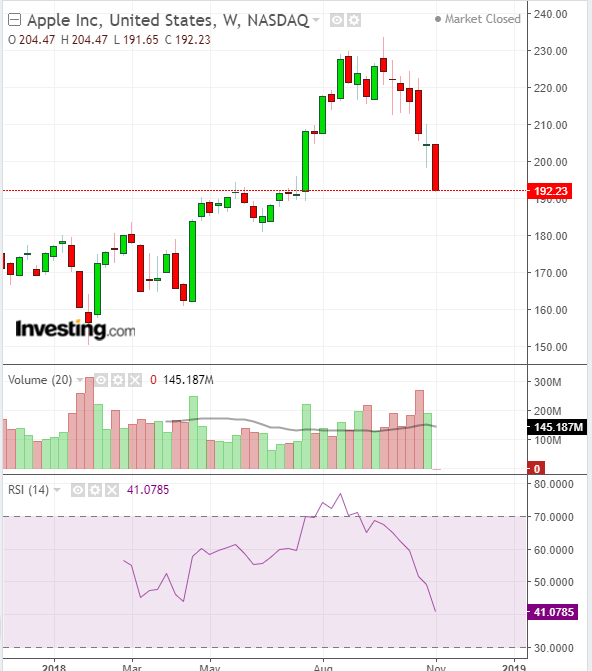
The RSI is visible in the purple box at the bottom. The indicator signals that shares are being sold off, but have not yet entered oversold territory.
Using the example above, if an investor owns 100 shares of Apple, and RSI reaches an overbought value of 75, which occurred during August 2018, they may want to sell some shares or exit the entire position while prices are higher than fair market value.
On the other hand, if that investor is holding the same shares and the RSI reading reaches an oversold value of 25, they may want to buy more shares with the expectation that prices will rise.
Using the RSI requires optimization for each market, to determine if the standard overbought and oversold values of 70 and 30 are appropriate. This is due to the fact that values of 80 and 20 may be better indications of overbought and oversold conditions in one market, while 60 and 40 may prove best for another market.
Below is a chart for Advanced Micro Devices (AMD) with an RSI chart. It shows a market that is not really overbought until it reaches values of 80.
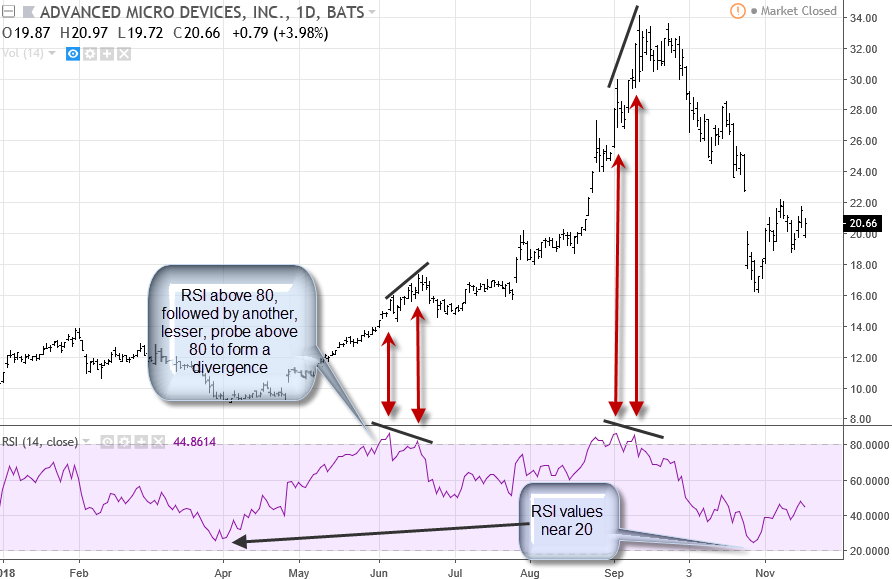
It also includes very good examples of divergences between the price of the stock and RSI values when conditions are overbought.
Currently, oversold readings are not quite getting below 20, which is typical of a market that is skewed bullishly. Once values below 20 occur, one would expect the overall tone to shift bearishly. At that point traders and investors would be looking for the opposite of what has been happening: i.e., divergences near RSI values of 20.
The indicator can also be used to monitor if values are holding above 50--the midpoint of the scale--which would indicate that gains are occurring more frequently than losses. This is considered bullish because it shows that buyers are interested enough in the market to prevent selling activity from gaining momentum.
Divergence can occur when prices rise to a new high but RSI does not. For example, imagine that on June 1 prices for a specific stock peaked at a value of $125 and RSI reaches 75. On June 15, the stock’s price falls to $120 and RSI drops to 65. Finally, on June 30, the price rises to $130, but RSI only hits 72.
This would be a divergence between the two charts, since buying activity has outpaced what the corresponding RSI measurement can justify, suggesting that the $130 high is not likely to last and an investor would have a reason to exit a long position or initiate a short.
Advanced users of RSI generally combine it with trend indicators such as the Average Directional Index (ADX) which signals momentum strength. When the ADX is trendless, RSI overbought and oversold readings are valid.
But when the ADX indicates that a trend is underway, i.e., when the ADX is increasing, the RSI overbought and oversold readings are invalid. In fact, the RSI readings in the above case confirm the ADX trend, as long as RSI values remain overextended during the ADX trend.
To calculate RSI, fourteen-time periods (e.g., days, weeks, hours) are typically used, but optimization of the calculation may reveal that 10 or 21 periods, for example, are a better indication of market sentiment.
If we are given a set of 15 periods where the price change of each is:
(1,-2,3,8,2,-3,1,8,2,4,-6,9,-1,6,7)
The calculation of RSI0,
(14 data points are needed to begin; the period with a change of 6 is RSI0):
RSI0 = 100 - 100/(1+RS)
RS = Average Gain* / Average Loss*
* Regardless of the number of gains or losses
--> From the dataset:
RS = |((1+3+8+2+1+8+2+4+9+6)/10) / (-2+-3+-6+-1)/4 |= |4.4/-3| = 1.46
RSI0 = 59.35
The calculation of RSI1, at the 15th period:
RSI1 = 100-100/(1+RS)
RS = ((Average Gain X 13)+7)/14 X 1/(((Average Loss X 13) + 0)/14)
--> From the dataset:
RS = 4.49/2.78 = 1.615
RSI1 = 61.76
Investing.com provides the latest 14-period RSI readings under the Technical tab of the main page of each asset, e.g. here for Apple. Once on the Technical page, be sure to choose the preferred time interval from the menu at the top of the table. RSI charts can be found under the Chart tab, either Streaming or Interactive. When viewing the chart, use the Chart Options to add an RSI window to the chart.
As well, the Stock Screener allows users to set criteria for RSI, or any other indicator, under the Technical tab of the Criteria section. This is very useful to investors who are looking for markets with specific RSI values, e.g., buying opportunities for oversold markets.