
Zions Bancorporation (NASDAQ:ZION) reported second-quarter 2016 adjusted earnings of 44 cents per share, surpassing the Zacks Consensus Estimate of 42 cents. Moreover, this compared favorably with the year-ago earnings of 41 cents.
Better-than-expected results were driven by higher revenues and lower expenses. Further, growth in loans and deposits acted as tailwinds. However, these were partially offset by an escalated provision for loan losses. Capital position deteriorated during the quarter.
Net income applicable to common shareholders came in at $90.6 million, including the effect of securities gains and losses as against a net loss of $1.1 million in the year-ago quarter.
Rising Revenues and Declining Expenses Support Results
Net revenue (FTE basis) was $591 million, up 41.1% year over year. Further, the figure marginally beat the Zacks Consensus Estimate of $590 million.
Net interest income increased 9.7% year over year to $465 million. Further, net interest margin improved 21 basis points (bps) to 3.39%.
Non-interest income amounted to $126 million, as against a non-interest loss of $5 million in the year-ago quarter. The improvement was due toan increase in customer-related fees and other income, partially offset by a fall in dividends and other investment income, and fair value and non-hedge derivative income.
Adjusted non-interest expenses decreased 3% from the year-ago quarter to $384 million. Further, efficiency ratio was 64.5%, down from 71.1% a year ago. A fall in efficiency ratio indicates improvement in profitability.
Improved Balance Sheet
As of Jun 30, 2016, total loans, net of allowance grew 2.7% from the prior quarter to $41.9 billion. Also, total deposits rose 0.8% from the previous quarter to $50.3 billion.
Credit Quality Weakened
The ratio of nonperforming lending-related assets to net loans and leases as well as other real estate owned increased 34 bps year over year to 1.30%.
Further, provisions for loan losses came in at $34.5 million, compared with $0.6 million in the prior-year quarter. Moreover, net charge-offs were $38 million, up from $11 million in the year-ago quarter.
Capital Ratios Deteriorated, But Profitability Improved
Under the Basel III rules, Tier 1 leverage ratio came in at 11.25%, as of Jun 30, 2016, down from 11.65% in the prior-year quarter. Tier 1 risk-based capital ratio came in at 13.39% compared with 14.26% in the year-ago quarter.
Return on average assets was 0.77% as of Jun 30, 2016, up from 0.10% as of Jun 30, 2015. Also, as of Jun 30, 2016, tangible return on common equity was 6.31%, drastically up from 0.03% a year ago.
Our Viewpoint
Zions remains well positioned for future growth based on consistent improvement in loans and deposits, and curtailment of expenses. Also, the company’s efforts to restructure its balance sheet continue to be impressive. It helped the company to raise its quarterly dividend as a part of its 2016 capital plan.
Nevertheless, we remain apprehensive of an asset-sensitive balance sheet and regulatory restrictions, which are likely to weigh on the company’s financials in the near term. Further, Zions’ significant exposure to stressed energy sector loans continues to be a matter of concern.
ZIONS BANCORP Price, Consensus and EPS Surprise
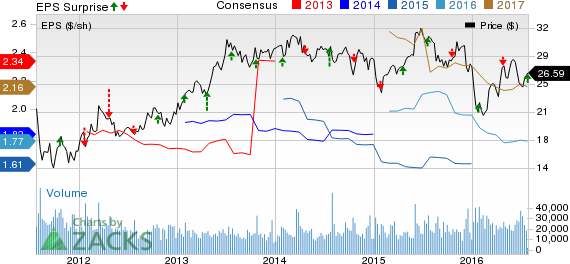
ZIONS BANCORP Price, Consensus and EPS Surprise | ZIONS BANCORP Quote
Currently, Zions carries a Zacks Rank #3 (Hold).
Performance of other West Banks
First Republic Bank (NYSE:FRC) recorded earnings of 89 cents per share, lagging the Zacks Consensus Estimate of 91 cents. A sizeable growth in non-interest expenses was primarily responsible for the lower-than-expected results. However, lower provisions were on the positive side.
Westamerica Bancorp’s (NASDAQ:WABC) second-quarter 2016 earnings of 57 cents per share were in line with the Zacks Consensus Estimate. Results were largely affected by a decline in revenues. However, a fall in operating expense and absence of provisions were enough to counter the decline.
BofI Holding, Inc. (NASDAQ:BOFI) will announce results on Aug 2.
WESTAMER BANCP (WABC): Free Stock Analysis Report
ZIONS BANCORP (ZION): Free Stock Analysis Report
FIRST REP BK SF (FRC): Free Stock Analysis Report
BOFI HLDG INC (BOFI): Free Stock Analysis Report
Original post
Zacks Investment Research