Century Bancorp Inc (NASDAQ:CNBKA) stock had a calm day in the market on Friday April 13. Shares moved 0.31% and closed the day at $79.75. They're now trading 10.79% below their 52-week high of $89.4.
With today's slight gain, Century Bancorp now has a market cap of $445 million. That makes it a small cap company.
The business operates in the commer banks-eastern us industry and employs 385 people. Its shares trade primarily on the NASDAQ stock exchange.
Century Bancorp has 3.61 million shares outstanding and 2,738 traded hands for the day. That's below the average 30-day volume of 8,496 shares.
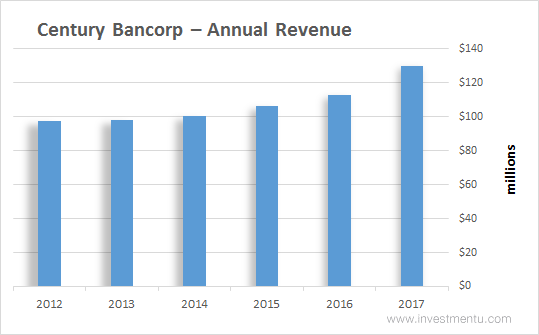
Over the last five years, Century Bancorp's revenue is up by 33.51%. You can see this growth in annual revenue chart below...

In the last year alone, Century Bancorp's revenue has grown by 15.11%. That's a solid sign for Century Bancorp stock owners.
We like to invest in companies that grow their sales. A growing top line is a sign of a healthy business.
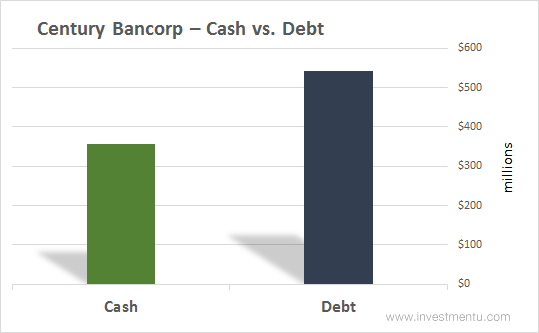
For now, Century Bancorp will continue to pull in revenue. So let's take a closer look at the company's total financial health. And the best way to do that is by looking at its balance sheet... Century Bancorp's cash comes in at $357 million and the company's debt is $543 million...

Century Bancorp's cash pile is smaller than its total debt. This is common for many companies. They can issue debt at a lower cost to take on new projects.
What is Century Bancorp Stock Worth?
Let's look at a few key ratios to determine the value of Century Bancorp stock…
Price-to-Earnings
P/E is a valuation ratio of a company’s EPS compared to its current share price. Generally speaking, a high P/E means the market is bullish on a stock, but it can also signal that a stock is overpriced. What we look for is a stock trading below its industry average. This means we can get a better deal on a stock compared to its peers. (P/E): This ratio comes in at 15.82 for Century Bancorp. That's a reasonable level. A high P/E ratio shows that investors are already expecting high earnings growth.
Price-to-Book (P/B): This ratio is a cornerstone for value investors. A lower number here indicates a better value play. And at 1.66, Century Bancorp looks reasonable… but P/B varies greatly based on the industry.
These two metrics are a great place to start when valuing a company... but your analysis should go much deeper...
