The Japanese yen continued to strengthen significantly across the board and investors digested news about the potential tapering. On Tuesday, BoJ announced that it would reduce its bond purchases on the longer term 20 and 40 year bonds. This led the markets to react to the news as a form of tapering from the BoJ. Following through on the gains from Tuesday, the Japanese yen rose 1.07% on the day on Wednesday.
Economic data remained sparse with the exception of the manufacturing and industrial output data from the UK. According to the report from the ONS, UK's manufacturing output rose 0.4% on the month beating estimates of a 0.3% increase. Industrial output was also stronger, rising 0.4% on the month as expected. Construction output was weaker at 0.4%, missing estimates of a 0.7% increase.
Looking ahead, economic data will shift to the U.S. with the producer price index data expected to show a 0.2% increase on the headline and 0.2% increase on the core. FOMC Member, Dudley will be speaking later in the day.
EUR/USD intra-day analysis

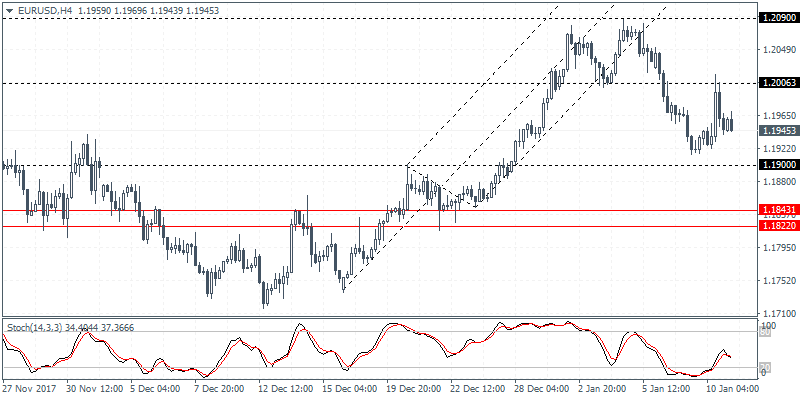
EUR/USD (1.1945): The euro managed to post gains on the day as the yen's strength was seen weakening the U.S. dollar. EUR/USD rose to a session of high of 1.2017 before the common currency gave up those gains to settle the day at 1.1947. The rebound in prices saw EUR/USD briefly testing the support level at 1.2006 as mentioned in yesterday's note. The declines could likely resume in the near term as the technical support level at 1.1900 remains yet to be tested. Further gains could be seen coming only on a bullish close above 1.2006 level.
USD/JPY intra-day analysis

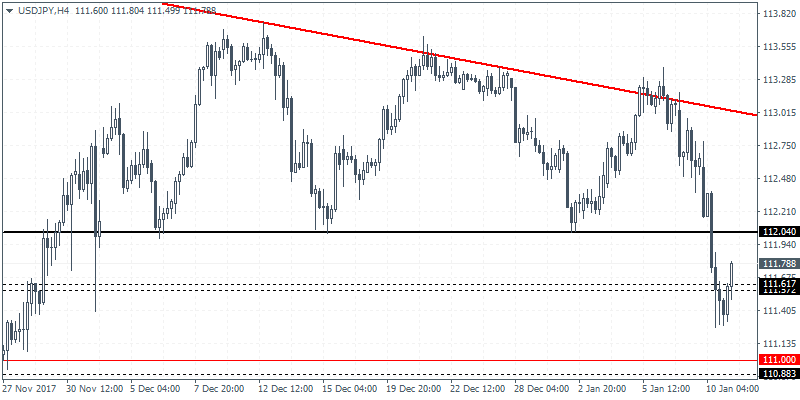
USD/JPY (111.76): The USD/JPY broke down strongly to the downside from the triangle pattern on the daily chart. Price action is likely to eventually test lower at 110.70 which is pending a retest of support. On the 4-hour chart, USD/JPY broke past the short term support at 111.61 - 111.57 region. This potentially clears the way for further declines down to 111.00 which could be tested once again. The short term outlook remains flat with USD/JPY likely to trade within the new corridor.
NZD/USD intra-day analysis

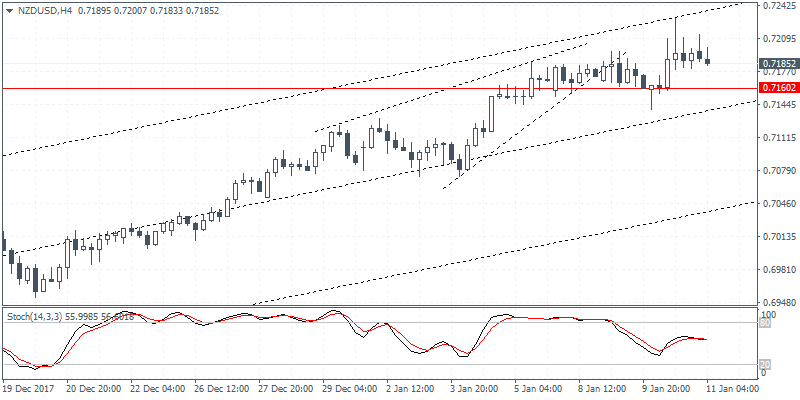
NZD/USD (0.7185): The New Zealand dollar was broadly unmoved as the Kiwi maintained gains against the U.S. dollar. However, on the daily charts, price action closed with a strong outside bar and a possible bullish engulfing pattern as well. But the gains are capped by the falling trend line connecting the highs from July 27 and September 20 from last year. We expect some consolidation to take place but eventually NZD/USD is likely to post declines that could be confirmed on a break down below the current support at 0.7160.
