Get 40% Off
⚠ Earnings Alert! Which stocks are poised to surge?
See the stocks on our ProPicks radar. These strategies gained 19.7% year-to-date.
Unlock full list

XAU/USD Weekly Overview Technical Trend Levels And Strategy: Jan 21 2018

Published 01/21/2018, 04:51 PM
Updated 07/09/2023, 06:32 AM

Gold Weekly Best Buy level 1319, resistance or best sell level 1328.60 (current support), A break above 1338.20, Upside target capped at 1360 - 1370, However, a crack below 1309 downside target in Focus 1286 - 1276

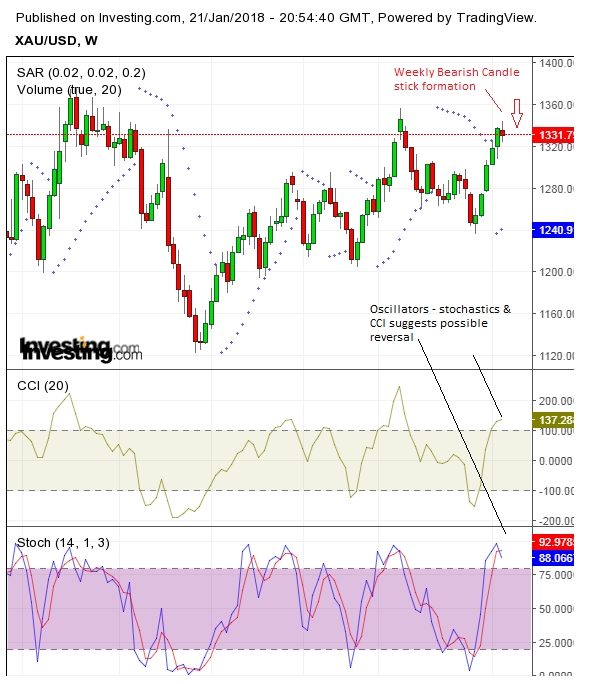
Technical snapshot: As of daily trend indicators are pointing towards southward's suggesting we are still on the bearish side, followed by weekly technicals indicators seem's exhausted & formation of a bearish candlestick pattern on the weekly charts might be indicating upside is limited and the bulls are on exhaustion point,

I strongly recommend traders to see things in a broader perspective & not to ignore what the monthly time frame indicators have to say.

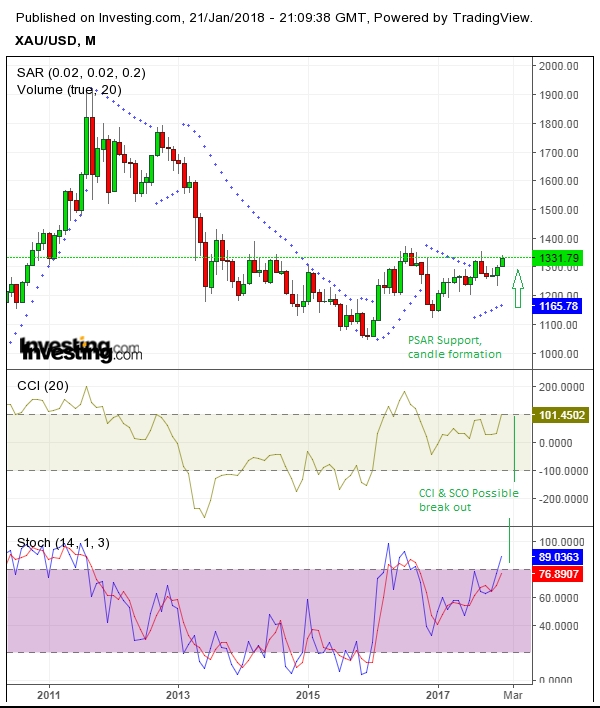
Monthly - CandleStick Pattern: Three white soldiers in formation, Parabolic SAR is giving support, followed by stochastic oscillators and commodity channel index pointing towards a possible breakout point.

When monthly bulls are in charge, No daily weekly technical indicators subdue the bulls. The prices are going to bounce back from all lows no matter the numbers to run and complete its full course.

Risk Range: 1276 - 1285 to 1360 - 1370

Alternative Scenario: There is No better Indicator than Price Action

If the weekly bearish cloud sets in for a while, price action suggests a drop in prices to 1278 levels is possible only below 1303 sets 1286 - 1276 in focus, gap filling point from its 1236 to 1344 run up lately.

Approach: Early week Short positions above 1332 - 1337 for target 1320.

Risk appetite traders buy zone below or b/w 1320 - 1310 with stops or reversal below 1303. If hold then 1329 acts a new break out point, once the above levels fill.

Gold XAU/USD Prices Now at 1331.80

Gold Weekly ChartGold monthly Chart

Latest comments

Gold xauusd fills 1st target 1360
Risk Disclosure: Trading in financial instruments and/or cryptocurrencies involves high risks including the risk of losing some, or all, of your investment amount, and may not be suitable for all investors. Prices of cryptocurrencies are extremely volatile and may be affected by external factors such as financial, regulatory or political events. Trading on margin increases the financial risks.
Before deciding to trade in financial instrument or cryptocurrencies you should be fully informed of the risks and costs associated with trading the financial markets, carefully consider your investment objectives, level of experience, and risk appetite, and seek professional advice where needed.
Fusion Media would like to remind you that the data contained in this website is not necessarily real-time nor accurate. The data and prices on the website are not necessarily provided by any market or exchange, but may be provided by market makers, and so prices may not be accurate and may differ from the actual price at any given market, meaning prices are indicative and not appropriate for trading purposes. Fusion Media and any provider of the data contained in this website will not accept liability for any loss or damage as a result of your trading, or your reliance on the information contained within this website.
It is prohibited to use, store, reproduce, display, modify, transmit or distribute the data contained in this website without the explicit prior written permission of Fusion Media and/or the data provider. All intellectual property rights are reserved by the providers and/or the exchange providing the data contained in this website.
Fusion Media may be compensated by the advertisers that appear on the website, based on your interaction with the advertisements or advertisers.
© 2007-2024 - Fusion Media Limited. All Rights Reserved.