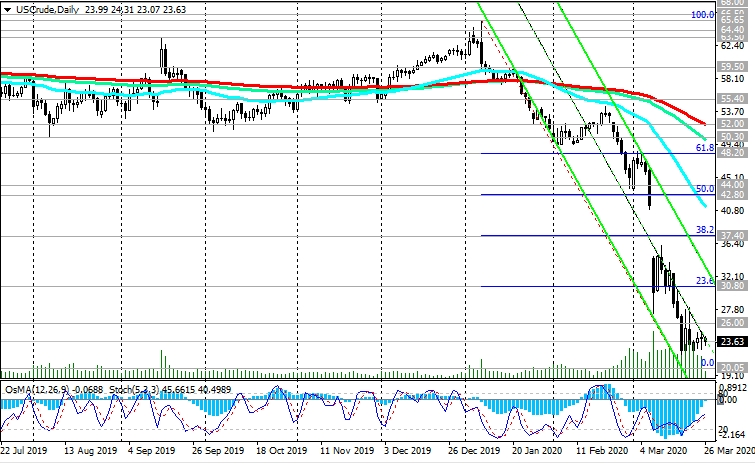
Oil quotes remain under pressure. The pessimism of the oil market participants associated with the price war among the largest oil producers, the coronavirus pandemic and the slowdown in the global economy, and as a result - a decrease in oil demand, is pushing oil prices towards new multi-year lows.
Having broken through the key support level of 57.00 (EMA200 on the daily and weekly charts) in January, the price of WTI crude oil rushed down, updating the record for falling in March. The 4-year low at the psychologically important support level of 26.00 also could not resist, and the price fell last week to record lows near the mark of $ 20.00 per barrel.
The decline in WTI crude oil over the past 3 months has been 78% to date. Last week, a new anti-record was broken when WTI oil quotes fell to around $ 20.05 per barrel.
On Thursday, oil market participants will follow an emergency G20 summit where statements can be made regarding the price war between major oil producers.
Investors still hope that the price war between leading oil exporters, including the United States, Russia and Saudi Arabia, will end soon.
This is a positive factor for oil quotes.
At the same time, quarantine measures taken in connection with the coronavirus pandemic, according to economists, can lead to a decrease in April of global oil demand by 18.7 million barrels per day. Such a large-scale drop in demand can outweigh any reduction in oil production, including a possible freeze or restriction of OPEC production, oil market analysts say.
Currently, a strong negative impulse prevails, holding oil quotes near multi-year lows.
The first timid signal for purchases may be a breakdown of the resistance level of 26.00 (EMA200 on the 1-hour chart and the recent 4-year low). In case of further growth and after the breakdown of the resistance level of 30.80 (Fibonacci level 23.6% of the upward correction to the fall from this year's highs near 65.65 to the local minimum of 20.05), the price may go towards the level of 52.00, through which EMA200 on the daily chart is currently passing.
However, short positions are preferred, which are best entered at the rebound from the nearest resistance zone near the levels of 26.00, 27.00, 28.00, 29.00, 30.00.
Support Levels: 23.00, 22.00, 21.00, 20.00
Resistance Levels: 26.00, 28.10, 30.80, 37.40, 42.80, 44.00, 48.20, 50.30, 52.00
Trading Recommendations
Sell by market. Sell-Limit 26.00, 27.00, 28.00. Stop-Loss 28.50. Take-Profit 23.00, 22.00, 21.00, 20.00
Buy Stop 28.20. Stop-Loss 25.80. Take-Profit 30.80, 37.40, 42.80, 44.00, 48.20, 50.30, 52.00
