Breaking News
Investing Pro 0
🙌 It's Here: the Only Stock Screener You'll Ever Need Get Started

World Markets Update: S&P And SENSEX Indices Post YTD Gains

By Jill MislinskiMarket OverviewJun 26, 2018 12:21AM ET
www.investing.com/analysis/world-markets-update-200327675
World Markets Update: S&P And SENSEX Indices Post YTD Gains
By Jill Mislinski   |  Jun 26, 2018 12:21AM ET
Saved. See Saved Items.
This article has already been saved in your Saved Items
 
 
UK100
+1.56%
Add to/Remove from Watchlist
Add to Watchlist
Add Position

Position added successfully to:

Please name your holdings portfolio
 
US500
+1.45%
Add to/Remove from Watchlist
Add to Watchlist
Add Position

Position added successfully to:

Please name your holdings portfolio
 
FCHI
+1.87%
Add to/Remove from Watchlist
Add to Watchlist
Add Position

Position added successfully to:

Please name your holdings portfolio
 
DE40
+1.25%
Add to/Remove from Watchlist
Add to Watchlist
Add Position

Position added successfully to:

Please name your holdings portfolio
 
JP225
+1.21%
Add to/Remove from Watchlist
Add to Watchlist
Add Position

Position added successfully to:

Please name your holdings portfolio
 
HK50
+4.02%
Add to/Remove from Watchlist
Add to Watchlist
Add Position

Position added successfully to:

Please name your holdings portfolio
 

Two of eight indexes on our world watch list have posted gains in 2018 YTD through till Monday, June 25, 2018. The top performer this year is India's BSE SENSEX with a gain of 4.90%. Second is our own S&P 500 with a gain of 1.63%. In third is France's CAC-40 with a loss of 0.54%. Coming in last is Shanghai's SSEC with a loss of 13.54%.

2018 Performance

Here is an overlay of the eight illustrating their comparative performance in 2018.

World Markets In 2018 As Of June 25

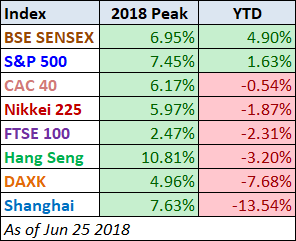
Here are all eight world indexes sorted by YTD.

A Longer Perspective

The chart below illustrates the comparative performance of World Markets since March 9, 2009. The start date is arbitrary: The S&P 500, CAC 40 and BSE SENSEX hit their lows on March 9th, the Nikkei 225 on March 10th, the DAXK on March 6th, the FTSE on March 3rd, the Shanghai Composite on November 4, 2008, and the Hang Seng even earlier on October 27, 2008. However, by aligning on the same day and using a log scale vertical axis, we get an excellent visualization of the relative performance. We've indexed each of the eight to 800 on the March 9th start date. The callout in the upper left corner shows the percent change from the start date to the latest weekly close.

World Markets since March 2009

Here is the same visualization, this time starting on October 9, 2007, the closing high for the S&P 500, a date that is approximately the mid-point of the range of market peaks, which started on June 1st for the CAC 40 and ended on January 8, 2008 for the SENSEX.

World Markets since October 2007

For a longer look at the relative performance, our final chart starts at the turn of the century, again indexing each at 800 for the start date.

World Markets since 2000

Check back next week for a new update.

Note: We track Germany's DAXK a price-only index, instead of the more familiar DAX index (which includes dividends), for consistency with the other indexes, which do not include dividends.

All the indexes are calculated in their local currencies.

Original post

World Markets Update: S&P And SENSEX Indices Post YTD Gains
 

Related Articles

World Markets Update: S&P And SENSEX Indices Post YTD Gains

Add a Comment

Comment Guidelines

We encourage you to use comments to engage with other users, share your perspective and ask questions of authors and each other. However, in order to maintain the high level of discourse we’ve all come to value and expect, please keep the following criteria in mind:  

  •            Enrich the conversation, don’t trash it.

  •           Stay focused and on track. Only post material that’s relevant to the topic being discussed. 

  •           Be respectful. Even negative opinions can be framed positively and diplomatically. Avoid profanity, slander or personal attacks directed at an author or another user. Racism, sexism and other forms of discrimination will not be tolerated.

  • Use standard writing style. Include punctuation and upper and lower cases. Comments that are written in all caps and contain excessive use of symbols will be removed.
  • NOTE: Spam and/or promotional messages and comments containing links will be removed. Phone numbers, email addresses, links to personal or business websites, Skype/Telegram/WhatsApp etc. addresses (including links to groups) will also be removed; self-promotional material or business-related solicitations or PR (ie, contact me for signals/advice etc.), and/or any other comment that contains personal contact specifcs or advertising will be removed as well. In addition, any of the above-mentioned violations may result in suspension of your account.
  • Doxxing. We do not allow any sharing of private or personal contact or other information about any individual or organization. This will result in immediate suspension of the commentor and his or her account.
  • Don’t monopolize the conversation. We appreciate passion and conviction, but we also strongly believe in giving everyone a chance to air their point of view. Therefore, in addition to civil interaction, we expect commenters to offer their opinions succinctly and thoughtfully, but not so repeatedly that others are annoyed or offended. If we receive complaints about individuals who take over a thread or forum, we reserve the right to ban them from the site, without recourse.
  • Only English comments will be allowed.
  • Any comment you publish, together with your investing.com profile, will be public on investing.com and may be indexed and available through third party search engines, such as Google.

Perpetrators of spam or abuse will be deleted from the site and prohibited from future registration at Investing.com’s discretion.

Write your thoughts here
 
Are you sure you want to delete this chart?
 
Post
Post also to:
 
Replace the attached chart with a new chart ?
1000
Your ability to comment is currently suspended due to negative user reports. Your status will be reviewed by our moderators.
Please wait a minute before you try to comment again.
Thanks for your comment. Please note that all comments are pending until approved by our moderators. It may therefore take some time before it appears on our website.
 
Are you sure you want to delete this chart?
 
Post
 
Replace the attached chart with a new chart ?
1000
Your ability to comment is currently suspended due to negative user reports. Your status will be reviewed by our moderators.
Please wait a minute before you try to comment again.
Add Chart to Comment
Confirm Block

Are you sure you want to block %USER_NAME%?

By doing so, you and %USER_NAME% will not be able to see any of each other's Investing.com's posts.

%USER_NAME% was successfully added to your Block List

Since you’ve just unblocked this person, you must wait 48 hours before renewing the block.

Report this comment

I feel that this comment is:

Comment flagged

Thank You!

Your report has been sent to our moderators for review
Continue with Google
or
Sign up with Email