Two weeks ago, I noted:
“I have a sneaky suspicion that when I update the Fed Balance Sheet reinvestment analysis next week, shown below, we are going to find a substantial, well-timed, reinvestment by the Central Bank. Wanna bet? Well, here is the updated chart of the 4-week net change to the Fed’s balance sheet. As you can see, reinvestments have, once again, returned to the market in a very “timely” fashion. Of course, since the Fed claims they are not trying to, nor are they influenced by, the markets, this is purely coincidental. (#SarcasmAlert)”
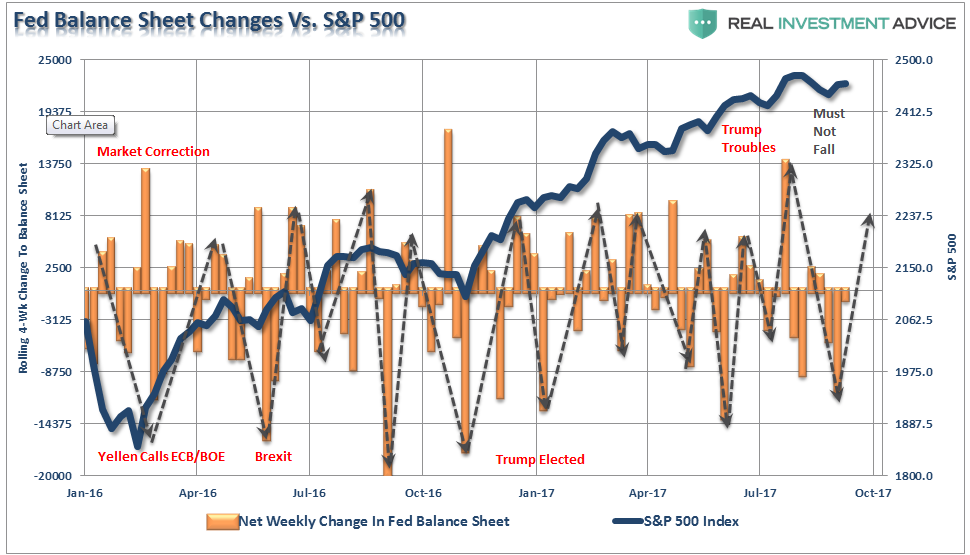
Here is the updated chart this week as the S&P 500 and other indices broke out to new “all-time highs.” I changed the coloration to more clearly show balance sheet expansion periods more closely.
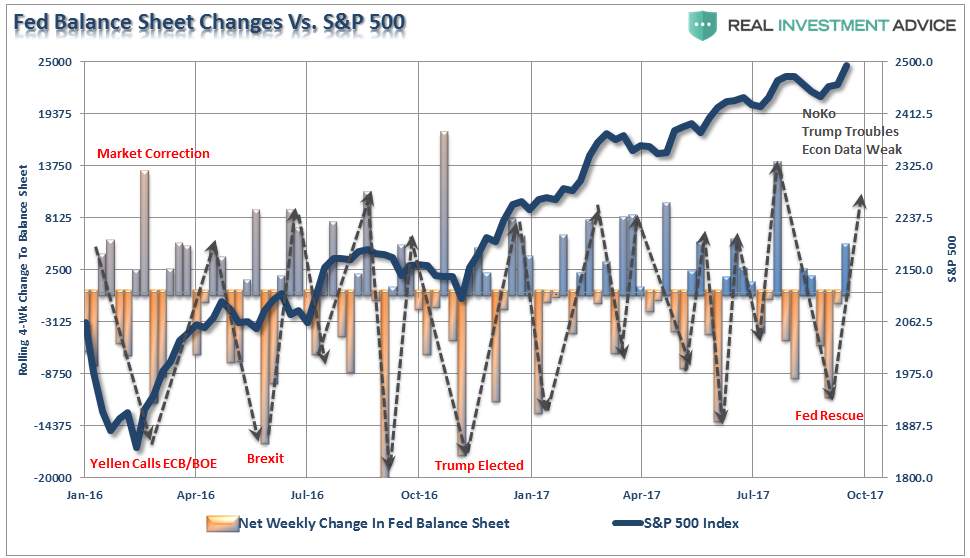
There are two things to take away from the chart.
- The current breakout of the market is likely limited given there is little room before the next down cycle in the balance sheet occurs.
- These reinvestments to “save” the markets from decline will be severely restricted IF the Federal Reserve actually proceeds with a “balance sheet reduction” program.
As noted on Tuesday:
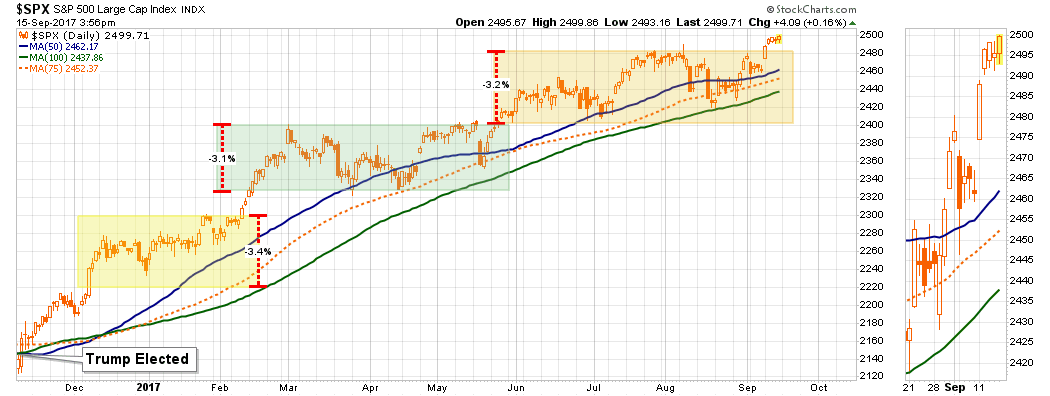
“That ‘gap up’ opening occurred Monday morning as ‘relief’ spread through global markets due to the reduction of geopolitical stress as the U.S. once again ‘caved’ to the threats of North Korea.”
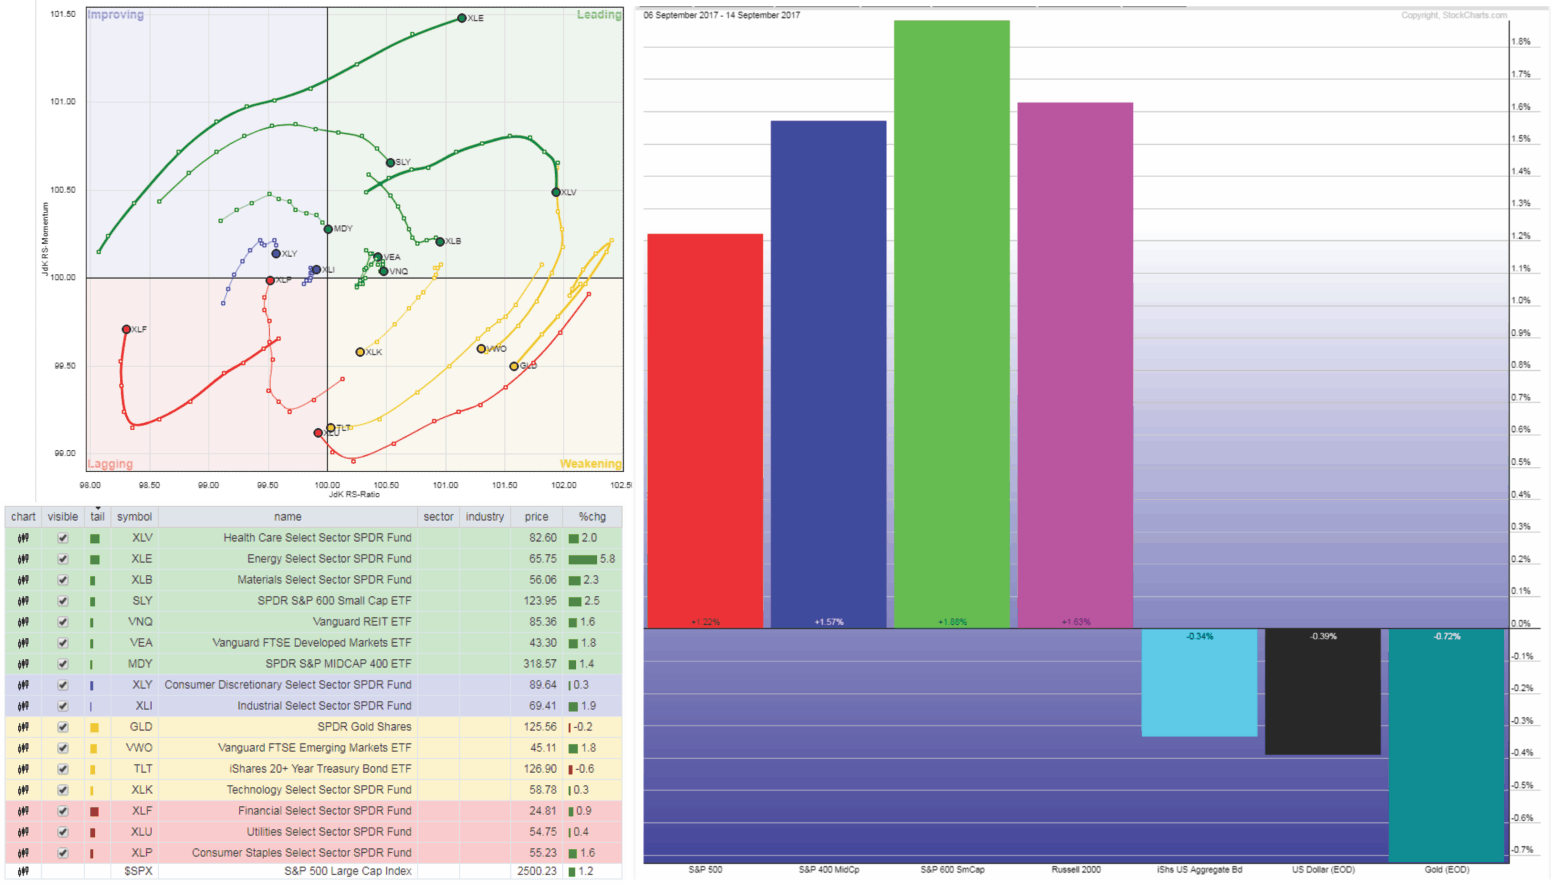
With that, and a lot of Central Bank intervention, the world breathed a sigh of relief as the previous “risk off” trade converted into a “rush for risk.” This rotation over the last 7-10 trading days out of bonds and gold back into equities can be seen in the chart below.
2500 or Bust!
Not surprisingly, and as I noted yesterday, the market very slightly breached 2500:
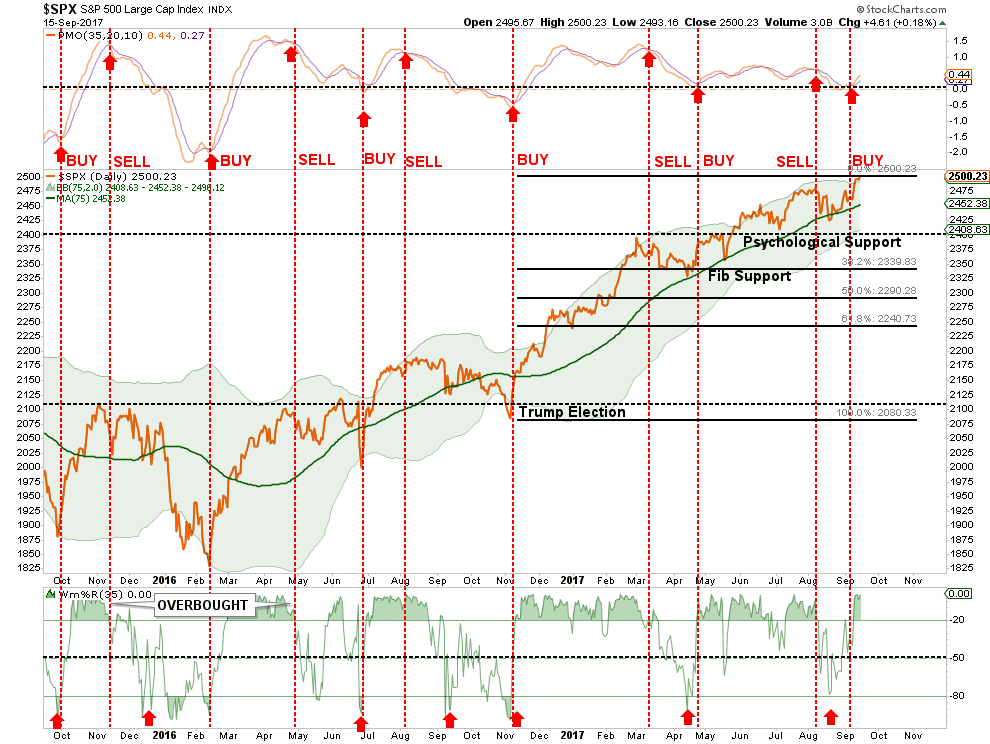
“Since the election, there has been a concerted effort to push stocks higher on the hopes of tax reform, ACA repeal, and infrastructure building which would lead to strongly improving earnings for U.S. companies. Now, eleven months later, stocks have been breaching the psychologically important levels of 2200 in December, 2300 in February and finally 2400 in May. 2500 is the next target.”
As shown below, the market is pushing a short-term “buy” signal. However, now at 2-standard deviations above the 75-dma, as seen previously, the market likely has limited upside from here. Look
Let me remind you this move is not unexpected. As I addressed back in June:
“Let me state this VERY clearly. The bullish bias is alive and well and a move to 2500 t0 3000 on the S&P 500 is viable. All that will be needed is a push through of some piece of legislative agenda from the current administration which provides a positive surprise. However, without a sharp improvement in the underlying fundamental and economic backdrop soon, the risk of something going ‘wrong’ is rising markedly. The chart below shows the Fibonacci run to 3000 if ‘everything goes right.’”
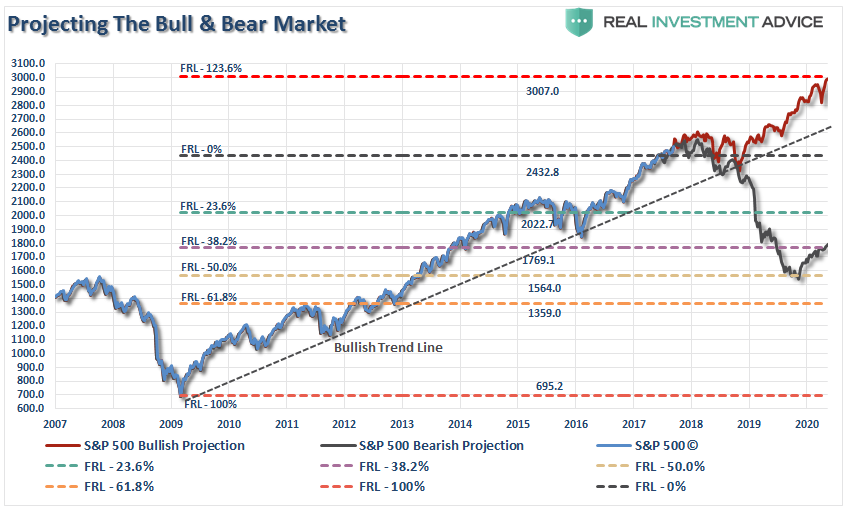
Despite the complete lack of legislative agenda, the markets did achieve its first milestone since that missive.
However, just remember, the bull-run is a one-way trip.
For now, the “bullish trend” remains intact which keeps portfolios allocated towards equities for now. BUT, and that is a “Kardashian” sized one, we do so with a “clear and present” understanding of the risk that we are undertaking. Stops have been moved up to recent support levels on all positions.
While there is some psychological support at 2400, the first level of Fibonacci support, post-election, is at 2340-ish. However, on a longer-term retracement, we are looking at a correction closer to 2000, and ultimately back to 1800ish.
The biggest concern currently is the massively elevated level of complacency. Regardless of threats of nuclear war, legislative agenda failure, missiles being launched over Japan, weak economics, and downwardly revised earnings estimates, the market has pushed higher on “hope.”
I have seen this environment before. We are in one of the longest periods on record without a 5% correction not to mention one of 10%. Volatility remains historically suppressed, and as noted on Thursday, investors are “all in the pool.”
The bulls have become completely desensitized to market risk.
I don’t know when.
Nor, do I know what will trigger it.
But a correction is coming and the following three charts are my biggest concern.
Chart 1) The current bull market cycle is already pushing one of the longest in history. With the support of global Central Banks, it could indeed become the longest. Regardless, it will end, and like all previously over-valued, over-extended, over-leveraged and overly-complacent bull cycle in history, it ends badly.
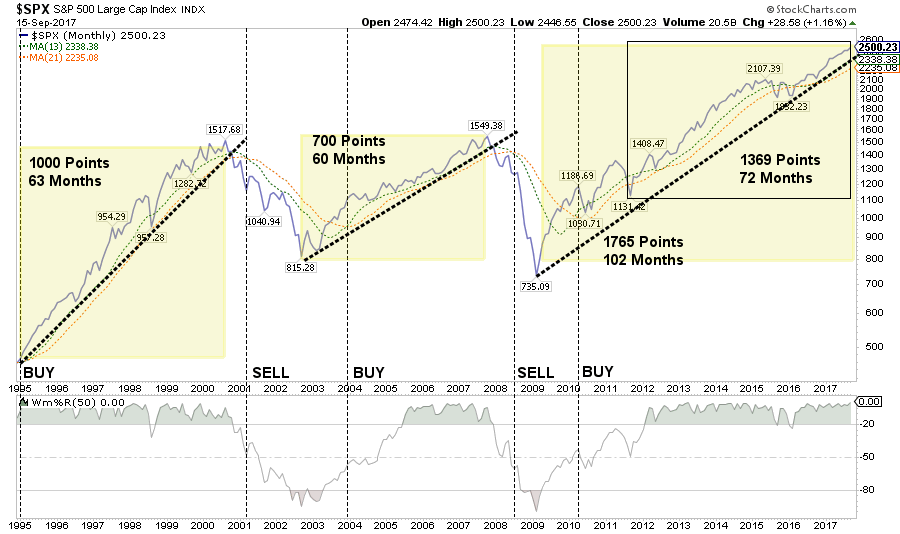
Chart 2) One of the hallmarks of a late-stage bull market cycle is the acceleration in price as investors capitulate by “jumping in” as prices accelerate. While the long-term moving averages currently suggest the bull cycle is intact, we will watch for the crossover to give us an indication of when to leave.
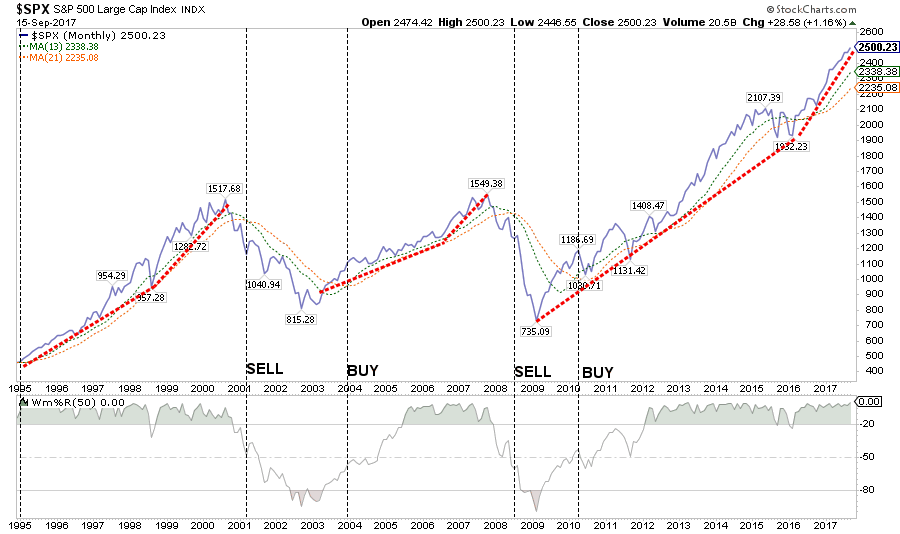
Chart 3) It is also not surprising to see earnings hit a “rough patch” before moving higher into the final phase of exuberance. The second downturn in earnings, particularly when sales are stagnating as they are now, tends to be the demarcation point of a repricing phase.
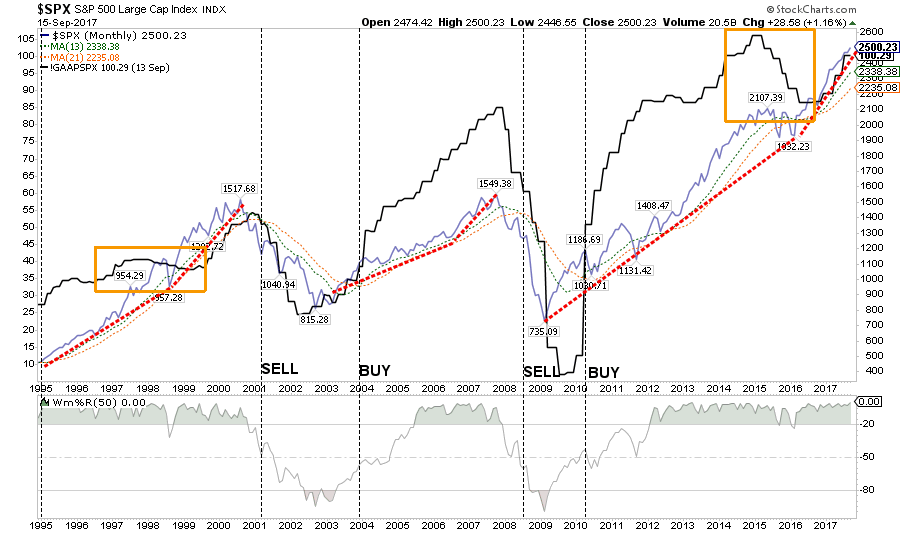
The ramp up in earnings in late 2016 and the first half of 2017 were a function of the rise in oil prices from the mid-30’s to the $50/bbl range. This led to a massive surge of 400% profit growth in the energy sector which boosted earnings higher for the index.
With oil prices stagnant over the last two-quarters, estimates are now being ratcheted lower as noted by FactSet recently.
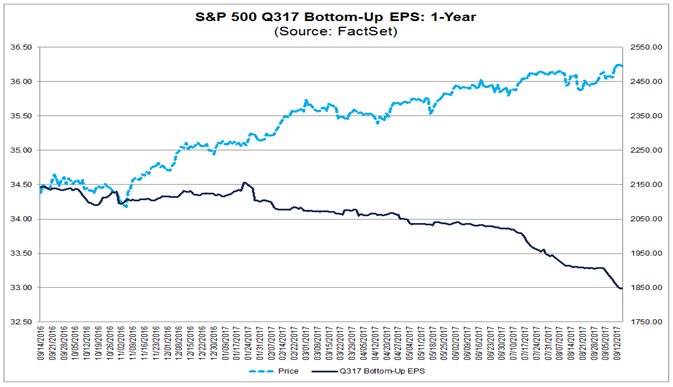
If tax legislation fails to be passed this year, it is likely we will see a much more aggressive repricing of expectations in the near future.
As I stated previously:
“The question you have to ask yourself is simply this.
‘From current levels, IF everything goes right there is roughly 600 points of upside. If something goes wrong there are 900 points of downside. Are those odds I am willing to take?’
It’s easy to get wrapped up in the bullish advance, however, it is worth remembering that making up a loss of capital is not only hard to do, but the ‘time’ lost can’t be.”
At this juncture, there is a large, and inevitable, loss of capital forthcoming.
As a “Game Of Thrones Fan” would say…

Bonds Send A Signal
Last week, I discussed the various economic indicators suggesting the “Trump Trade” has likely come to its conclusion.
Interest rates are also currently sending a signal that investors should heed.
As you know, I have been, and remain, a rampant bond bull. Since 2013, as the vast majority of mainstream analysts were touting the end of the “bond bull market,” I was aggressively buying bonds.
While we have recently pared back some of our bond holdings and took profits around 2.1% on the 10-year Treasury, we remain optimistically long corporate, GNMA and municipal bonds and are looking for the next opportunity to buy more bonds. (When you headlines about the “death of the bond market,” that is your signal to buy.)
When the next recession hits the U.S. economy, rates will fall below 1% as money flows to the relative safety of bonds as equity prices lose 30-50% of their value.
More importantly, and as shown below, interest rates on a monthly basis are at levels that have been associated with significant tops in both rates and stocks.
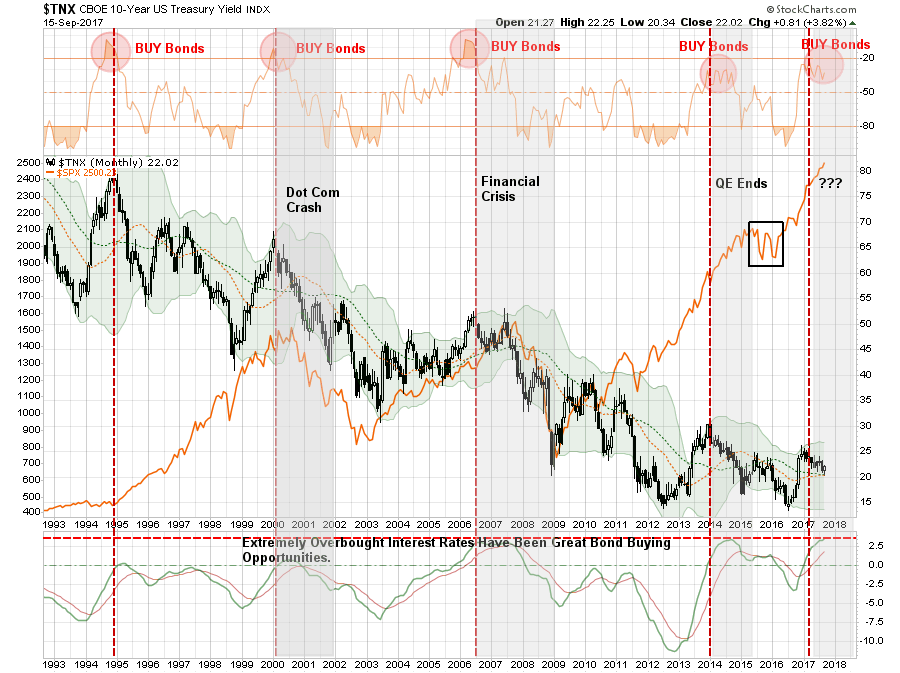
Whether or not you agree, there is a high degree of complacency in the financial markets. The realization of “risk,” when it occurs, will lead to a rapid unwinding of the markets pushing volatility higher and bond yields lower. This is why I continue to acquire bonds on rallies in the markets, which suppresses bond prices, to increase portfolio income and hedge against a future market dislocation.
In other words, I get paid to hedge risk, lower portfolio volatility and protect capital.
Bonds aren’t dead, in fact, they are likely going to be your best investment in the not too distant future.
“I don’t know what the seven wonders of the world are, but the eighth is compound interest.” – Baron Rothschild
Market and Sector Analysis
Data Analysis Of The Market and Sectors For Traders
S&P 500 Tear Sheet
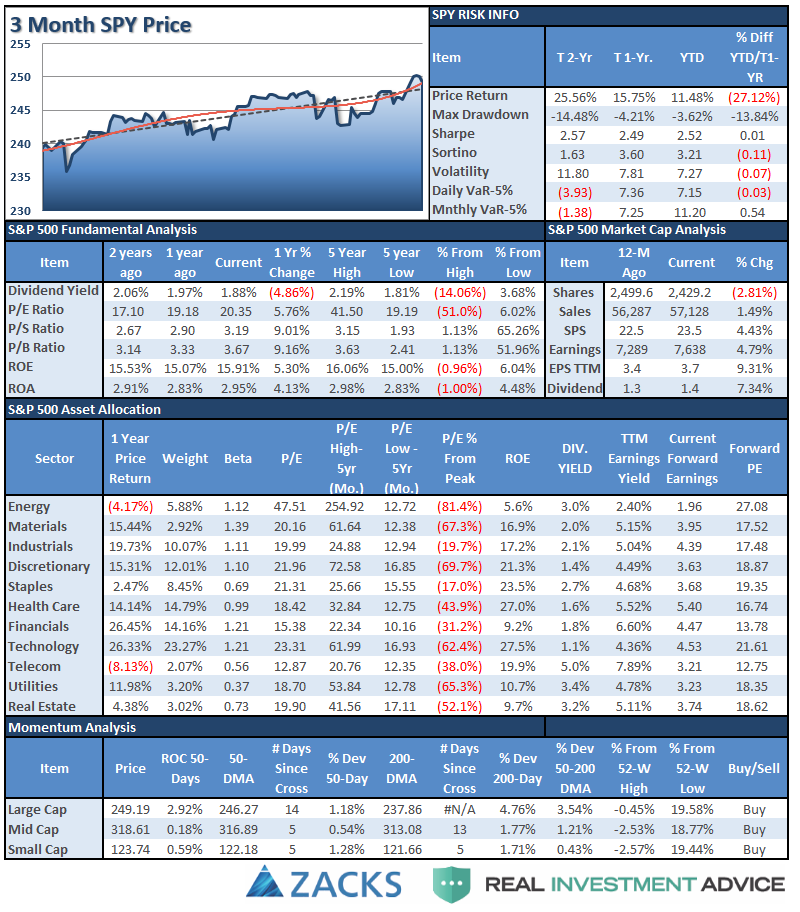
Performance Analysis
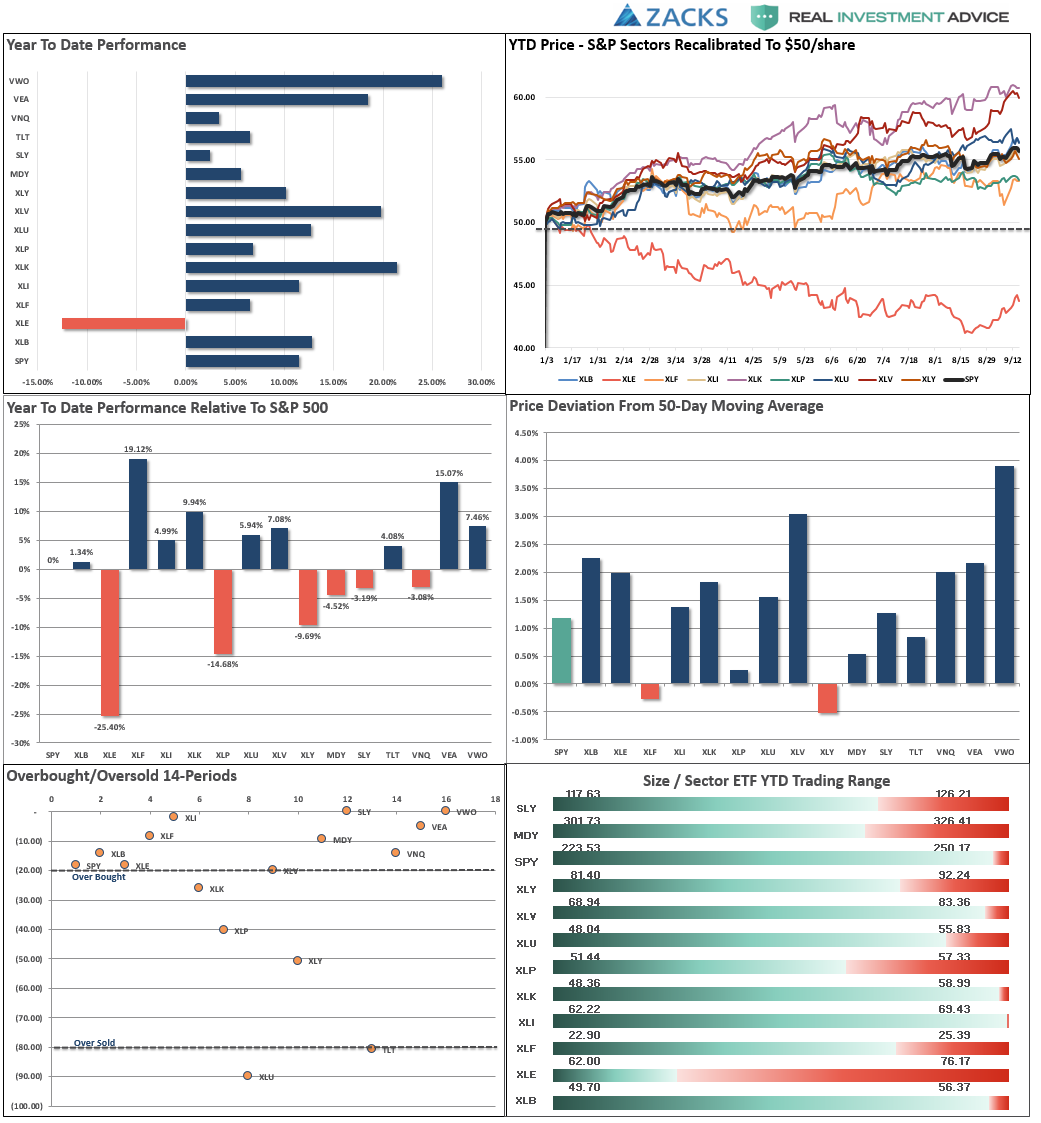
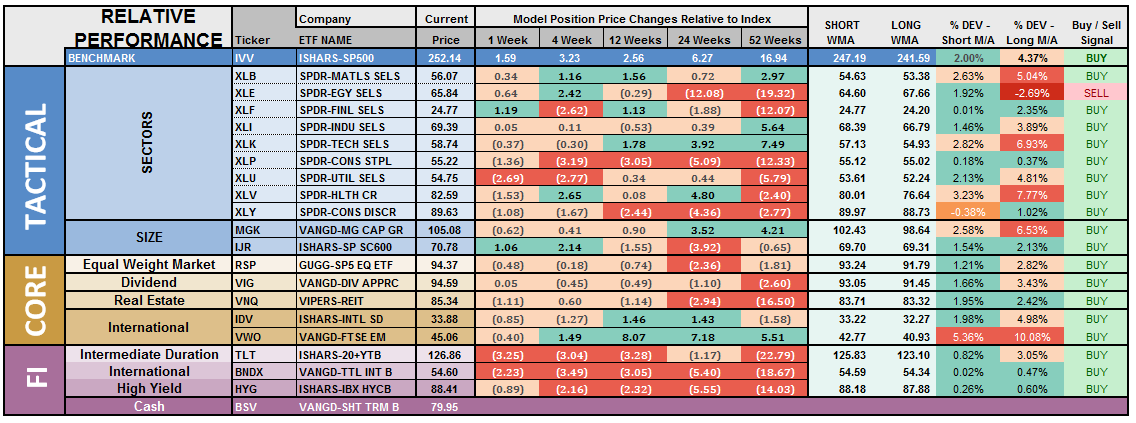
ETF Model Relative Performance Analysis
Sector and Market Analysis:
Let’s take a look at the sector breakdown.
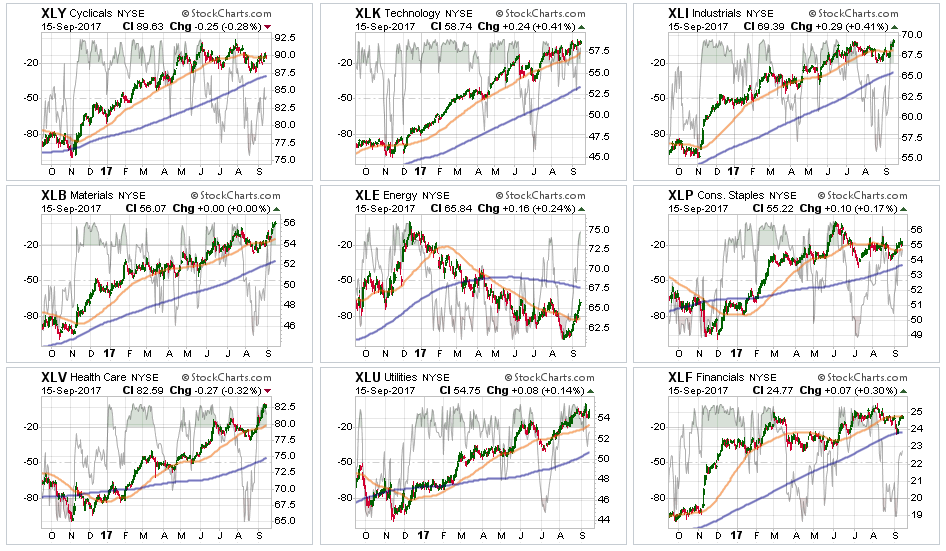
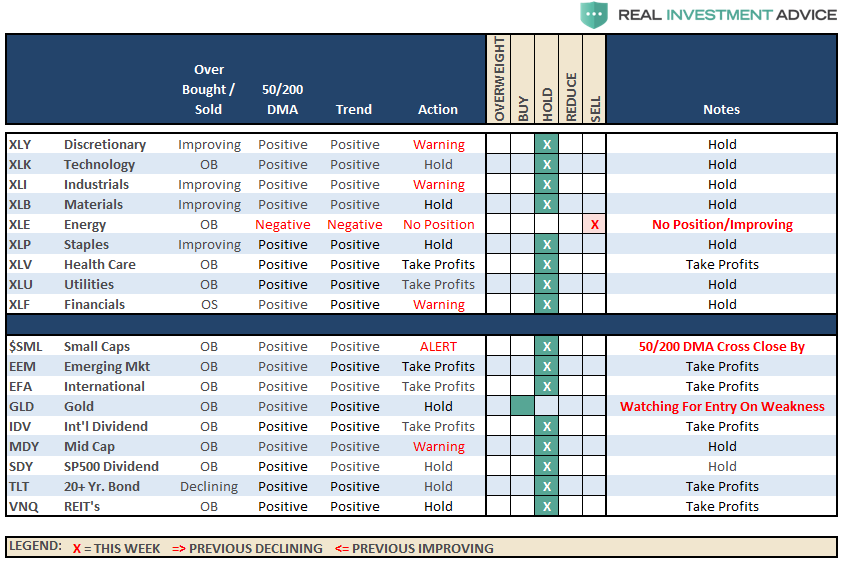
ALL SECTORS – improved this past week with each regaining above the 50-dma. This reduces some of the short-term negative pressure on the market. See recommendation analysis below for specific actions.
Energy, as noted over the last two weeks, has mustered a decent bounce but the trends and backdrop remain sorely negative. Oil prices remain weak and there is little that suggests the damage is over yet. It is advised to continue using bounces in energy as a means to reduce exposure to the sector. We continue to remain out of the sector entirely.
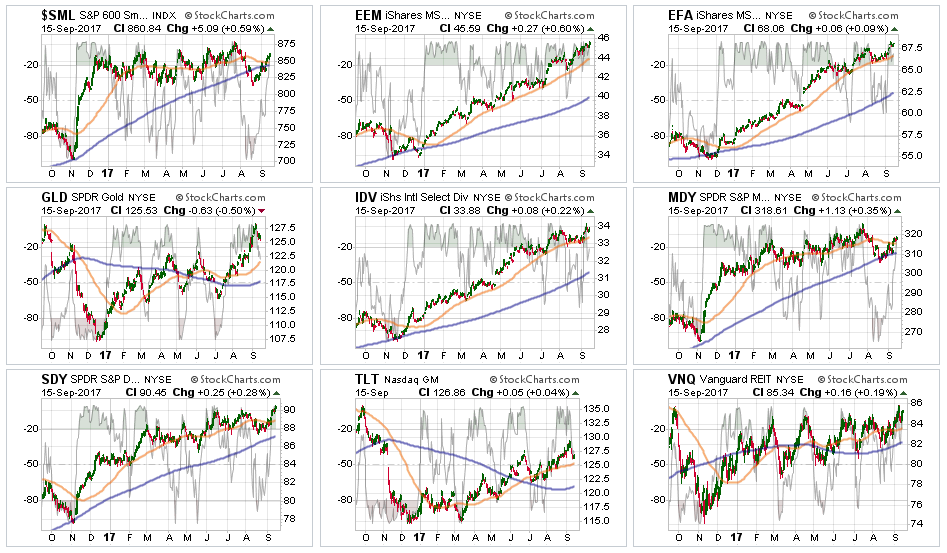
Small- and Mid-Cap stocks bounced last week, regaining their 50-dma and pulling more of the recent negative pressure off of the markets. With both indices back to overbought look to take profits at any failure of new highs.
Emerging Markets and International Stocks continue to hold support and money has been chasing performance in these sectors as of late. Continue to hold positions for now but profit taking and rebalancing remains advisable.
Gold – As noted two weeks ago, Gold was able to break out of its trading range and its longer-term downtrend. With Gold once again very overbought, we will begin looking for an entry point on any weakness which does not reverse the recent breakout. Gold did weaken a bit this week as money rotated from safety to risk, with overbought conditions still present, remain patient for now.
S&P Dividend Stocks (IDV, SDY), after adding some additional exposure recently the index broke out to new highs. We are holding our positions for now with stops moved up to recent lows.
Bonds and REITs finally had some profit taking hit these positions last week on the “risk” rotation. As stated last week:
“REITs are looking to break out of a long consolidation cycle and bonds remain favorable. Continue holding current positions for now but we are looking to take some profits and rebalance holdings.”
We did take profits in bonds and are looking for the next opportunity to add more exposure on a further pullback that does not violate bullish trends.
Sector Recommendations:
The table below shows thoughts on specific actions related to the current market environment.
(These are not recommendations or solicitations to take any action. This is for informational purposes only related to market extremes and contrarian positioning within portfolios. Use at your own risk and peril.)
Portfolio Update:
As noted above, the overall bullish trend remains positive which keeps our portfolios allocated toward equity risk. We remain cautious of potential corrections giving the length of time the markets have been absent one. However, the trend remains the trend for now, and the recent recovery of the market above the 50-dma allowed us to allocate some capital in newer accounts to equity-related risk.
We remain extremely vigilant of the risk that we are undertaking by chasing markets at such extended levels, but our job is to make money as opportunities present themselves. Importantly, stops have been raised to trailing support levels and we continue to look for ways to “de-risk” portfolios at this late stage of a bull market advance.
Again, we remain invested but are becoming highly concerned about the underlying risk.
