Whilst expectations remain anchored towards a hike in December following the Fed minutes, the revelation that “many” members are worried inflation will remain low provided a solid reason to sell USD ahead of Thanksgiving. Admittedly it is typically a time of year traders want to square up positions anyway, but those who were holding on for hawkish minutes bailed a few hours earlier than they perhaps would have.
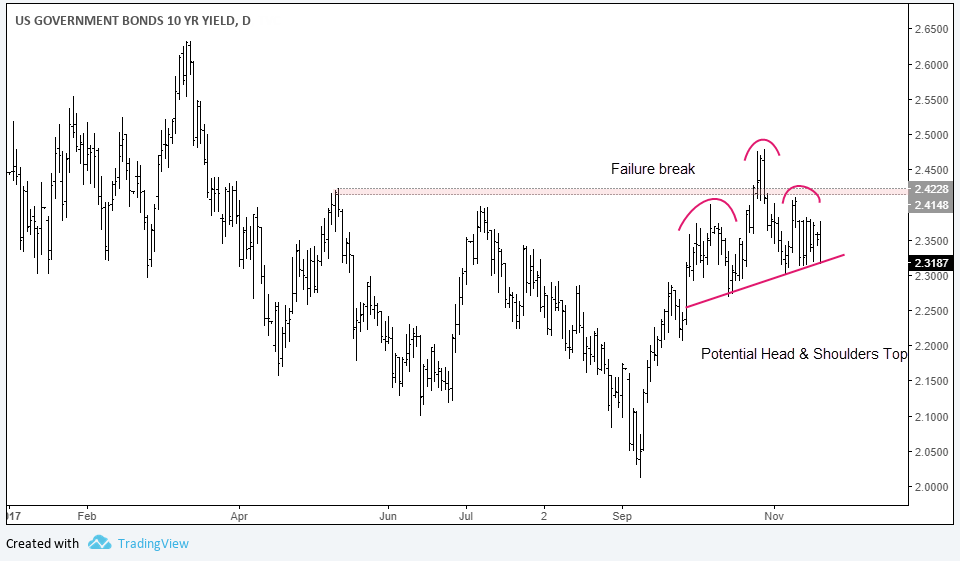
Whilst USD came under broad pressure, we’re keeping an eye on USD/JPY and US 10yr treasuries in particular. Sitting just above a rising neckline the 10yr shows potential to break lower and confirm a head and shoulders top pattern. As USD/JPY and 10 yr share a high correlation, we’d see a break lower in yields as significant for USD/JPY and the greenback in general. At time of writing the 60-day rolling correlation between them is 0.93, which is extremely high when you consider 1 means 100% correlated. Whilst correlations do not guarantee markets move in tandem on a daily basis, they can help confirm a trend or breakout of another. So that we see the US 10yr yield on the cusp of confirming a head and shoulders top, makes yesterday’s break lower on USD/JPY the more interesting.
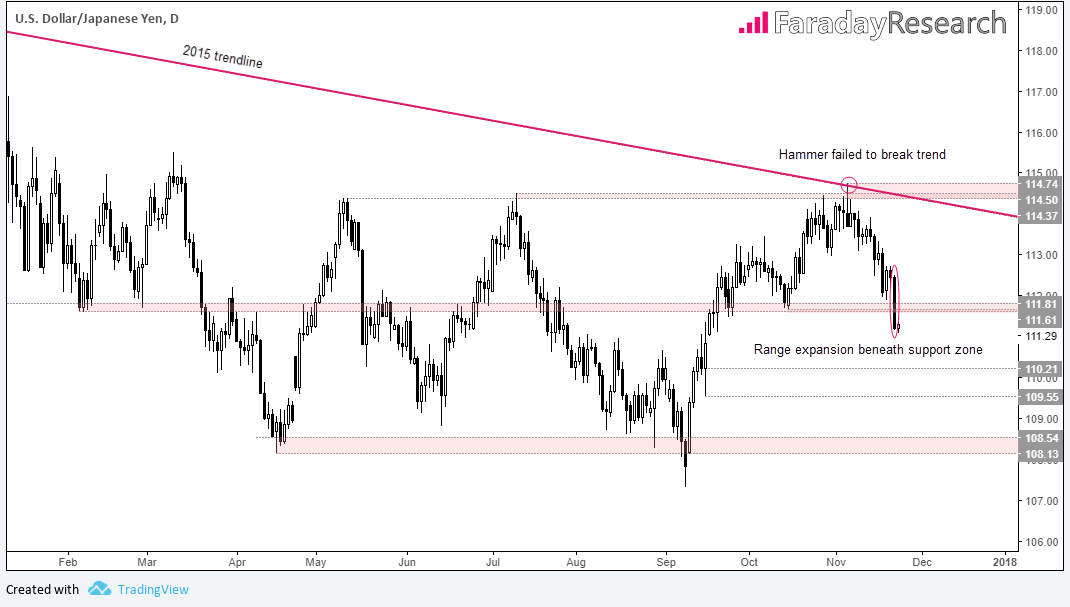
Focussing on USD/JPY daily chart, whilst bulls won the tussle over the 2015 trendline bears have so far had the last laugh over the 2015 equivalent. It didn’t appear to be much of a fight either, as only the high of a single bearish hammer managed to test the trendline before prices eventually rolled over.
Until yesterday price action remained above key support between 111.61-81 and USD/JPY was on the backburner until momentum tipped its hand with a decisive move. The Fed minutes provided the catalyst for a bearish range expansion beneath this structural level, and we now await a high probability entry for potential short trades. That the session closed near 9-week lows adds further credence to the bearish break, yet we should also resist temptation to simply wade in to the short side as range expansion usually followed by price compression. Even if we are to see an extension of losses, the probability of seeing a similar move to yesterday is very low according to our studies.
So from a tactical standpoint, we await price compression or a low volatility retracement to occur on the daily timeframe. In an ideal scenario, the US will celebrate thanksgiving and global markets will hibernate until liquidity returns, allowing compression to do its thing whilst price remains beneath 111.61-81. If we were then to see a clear decisive break lower on an intraday timeframe, we’d be satisfied the bears were back in control ad we’d seek bearish opportunities with a view to trade towards key structural levels.
Of course, markets aren’t always plain sailing and breakouts can turn into fake-out. We can see a similar move occurred in September, when a decisive move lower beneath 108.13 actually marked a 2-month low. That we also have the 10 yr yields above neckline support also leaves potential for USD/JPY to move back above resistance. And finally, as liquidity is expected to be much lower due to Thanksgiving, it also leaves markets more susceptible to low-liquidity volatility in the event of a surprise. And volatility doesn’t always stick with the trend. This is why we prefer to stand aside and wait for a high probability entry, which may take a couple of days.


