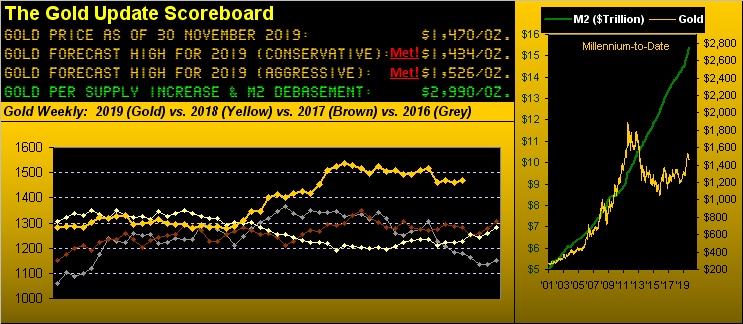
Gold settled out the week on Friday at 1470 en route to its best up year—at present +14.5%—since 2010.
Now obviously you Gold aficionados out there know that its highest closing price ever was 1900 on 22 August 2011, swiftly followed by its highest trade ever at 1923 on 06 September 2011. But Gold's overall performance that year was just +10.2% as its over-valuation vis-à-vis currency creation was met with enlightened evacuation: if you were reading us back then, you'll recall our repetitive phrase about "Gold getting ahead of itself." Price then ultimately resigned to decline to as low as 1524 come that December.
2011's performance was also overshadowed by 2010's net Gold gain of +29.5%, to this day still its third best annual performance (only to 2007's +31.2% gain and 1979's +136.2% surge leading into the January 1980 hyper-spike) since Nixon's nixing of the Gold Standard back in '71, (then followed by Gold's final undoing from the Dollar under Ford in 1976). That was then.
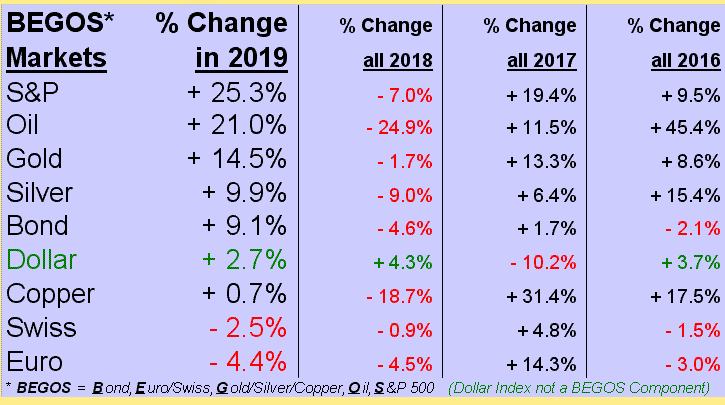
This is now: Given price's 1454-1434 "support shelf" inspiring our prior two missives respectively that "Gold Gets Supported; Downside Thus Thwarted!" and "Higher Gold Ahead," we continue to eye a viable close for this year north of 1500. Either way, Gold appears to have locked in a least a podium finish, presently standing in third place as we view the BEGOS Markets' changes year-to-date. Since a month ago at the end of October, the standings have remained static with only the S&P 500 having swapped Oil for first place, (yes that very S&P which nonetheless rose through a comparatively mediocre Q3 Earnings Season to now sport a "live" price/earnings ratio of 36.6x). Here are 2019's performances with but December in the balance:
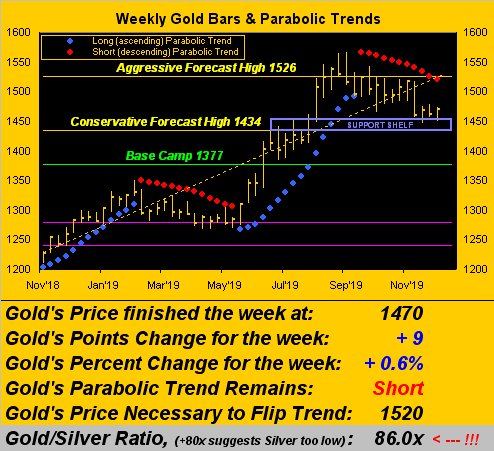
'Course, the lucid laggard in the list is Silver, just +9.9% despite its proven tendency to outrace Gold in both directions, the performance in 2010 of +68.5% being so exemplary. For nearly two years now the Gold/Silver ratio has made a home in the otherwise historically high, rarefied air of 80x, the present reading being 86.0x as shown at the foot of the following graphic. Therein we've Gold's weekly bars from a year ago-to-date, the rectangular "support shelf" stalwart in keeping further downside at bay as the red-dotted parabolic Short trend still makes its way without price itself really giving way. As to Gold's "expected weekly trading range" 'tis at present 39 points which (in that vacuum) is ample for price to reach 1500 in just the ensuing week should it be firm enough, let alone by year-end: indeed the "expected monthly trading range" is 72 points. Here are the bars:
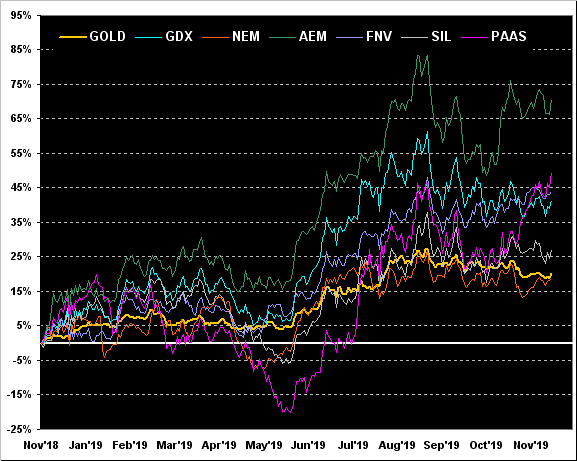
In maintaining our month-end mode, we've next Gold by its percentage track from one year ago-to-date astride those from several of the most visible precious metals equities: and nary-a-one is below +19% in year-over-year performance. Far and away leading the pack is Agnico Eagle Mines (NYSE:AEM) +71%; then we've what had been the most neglected of these main metals Pan American Silver (NASDAQ:PAAS) +49%; next is Franco-Nevada (NYSE:FNV) +44% followed by the VanEck Vectors Gold Miners exchange-traded fund (NYSE:GDX) +41%; in turn come the Global X Silver Miners exchange-traded fund (NYSE:SIL) +27% and Gold itself +20%. Finally in bringing up the rear from this time last year is Newmont Goldcorp (NYSE:NEM) +19% in having since absorbed the latter name. And for lick-lippin' leverage, a year ago PAAS was priced at 90% that of Silver itself; today 'tis at 113%:
Now unless you've been a-hidin' in an economic hole, you know the Federal Reserve Bank has engaged in printin' up a whole lotta foundationless faux dough these days. In fact for those of you scoring at home, it took 73 weeks for the U.S. money supply as measured by M2 to travel from $14 trillion to $15 trillion. But given the current slope of increase since crossing the $15 trillion threshold, reaching $16 trillion is on pace to occur in less than half that duration: just 31 weeks. Got Gold?
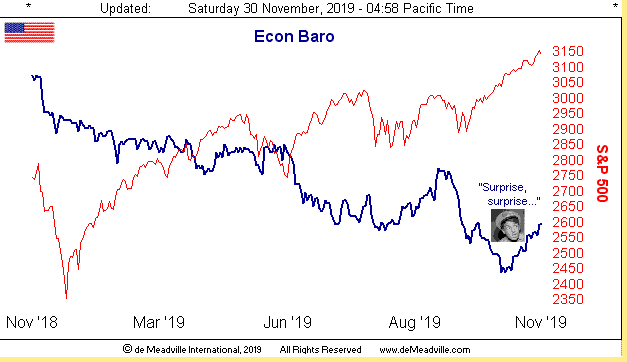
And yet the Economic Barometer has got some grip of its own, the surprise of this past week having been Q3 Gross Domestic Product revised upward from a +1.9% annual pace to +2.1%, whilst many a six-figured analyst were looking downward. Great work if you can get it, (but also keep it). Then too is the "never go down" S&P 500. Remember when the S&P was "Nuthin' but Apple (NASDAQ:AAPL)"? Today 'tis "Nuthin' but China." One of these days 'twill be "Nuthin' but Earnings". Oops... what earnings? Here's the Baro:
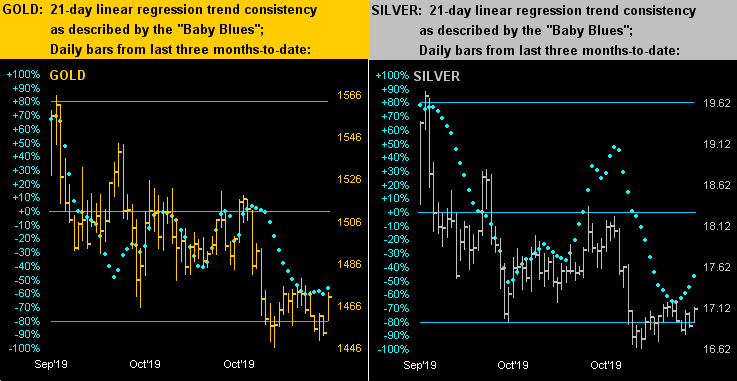
Specific to the precious metals and notably our notion of Gold clearing 1500 to end the year, here are the daily bars for the past three months. And for both Gold on the left and Silver on the right, price for the present is in consolidative basing, the baby blue dots of linear regression trend consistency acting in kind:
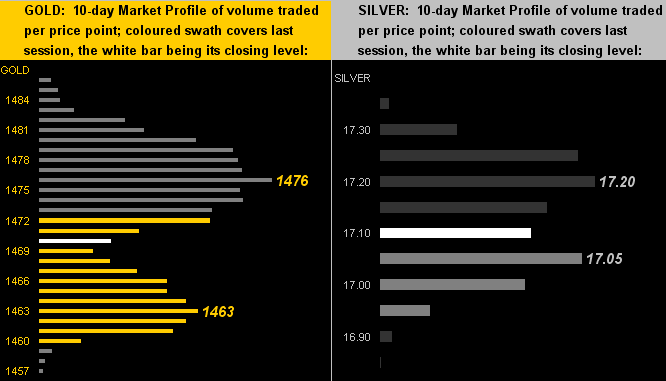
As to their respective 10-day Market Profiles for Gold (below left) and Silver (below right), the picture is pretty much the same as we saw a week ago, the yellow metal still having to hurdle the 1470s and the white metal needing to break above 17.20:
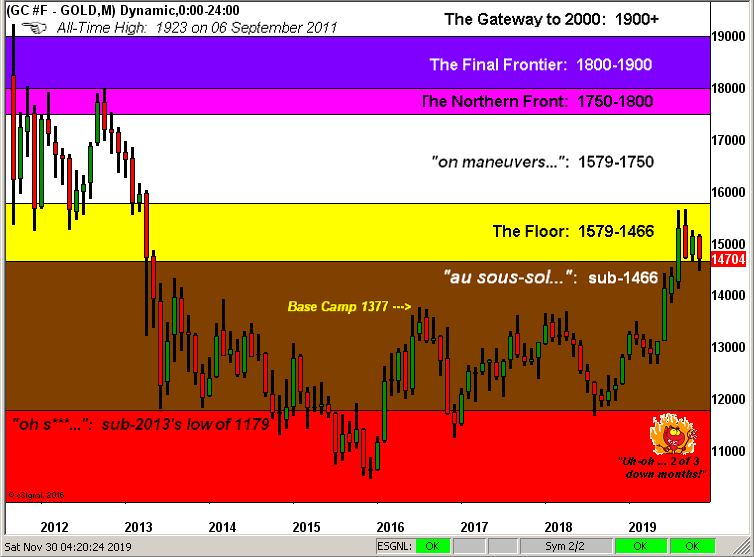
In closing out November, we finish with Gold's Structure by the monthly bars since 2011's All-Time High. The wee fellow at lower right thinks he's got the doom and gloom working for him; but as usual, he'll ultimately end up on the wrong, well, end:
To close, might Santa gift Gold at 1500 by New Year? An up year such as we have here doesn't always bring a happy December for Gold: indeed each of the up years 2006, 2007, 2011, 2012 and 2016 were December losers for Gold. So 'tis by no means out of the woods, snowy or otherwise. Still, should the 1454-1434 "support shelf" hold and price consolidation continue through here, we're thinkin' Gold 1500 to finish the year!