When assets reach prior highs, its time to pay attention from a Risk On & Risk Off basis.
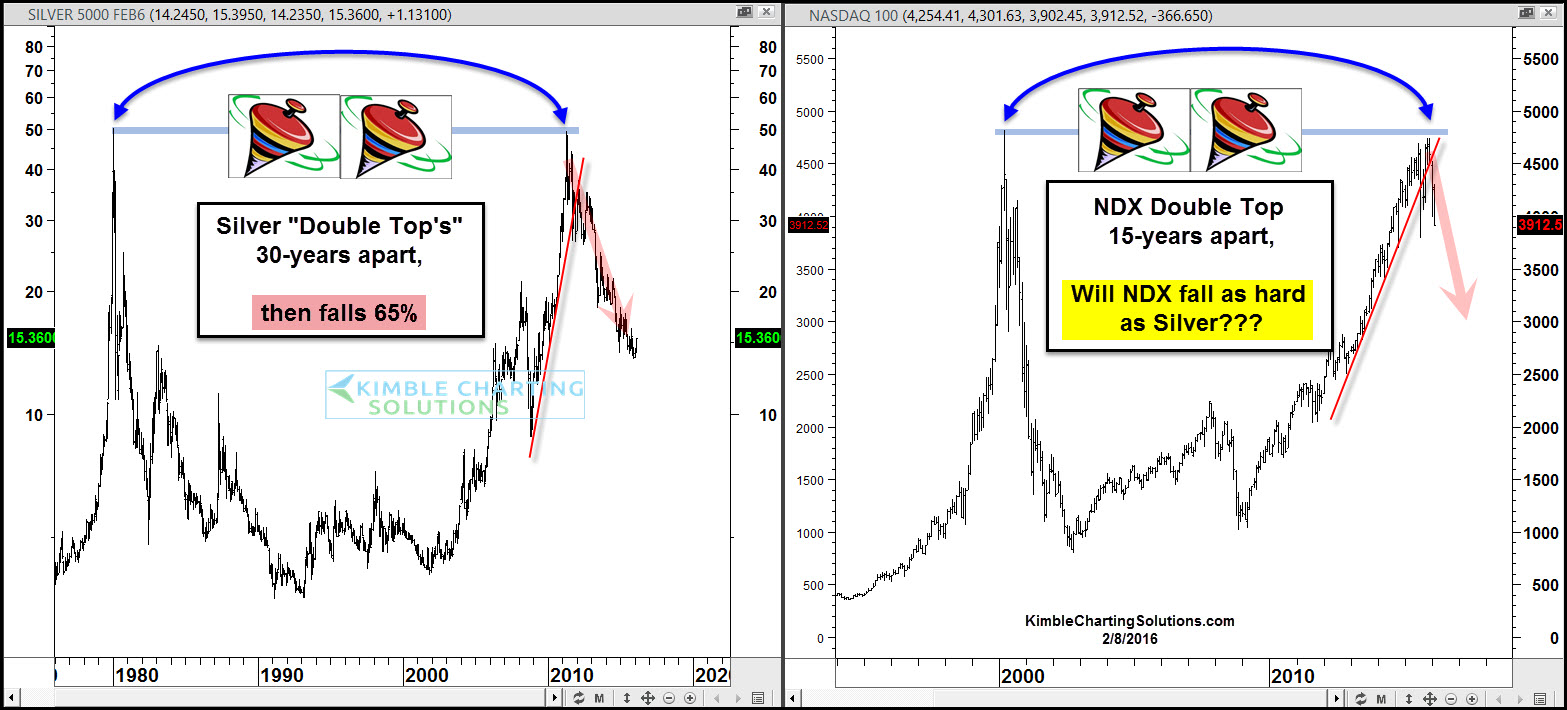
The chart on the left is silver, going back to the mid 1970s. As you can see it reached $50 in the early 1980s and then quickly reversed, losing over 90% of its value in the next 14-years. Then it embarked on a rally, starting in the early 1990’s. This rally took silver back to the $50 level in 2011, which ended up being a “Double Top” nearly 30 years later. After hitting the $50 level again, buyers disappeared and sellers stepped forward.
Selling pressure ended up driving silver down 65% in four years, after it hit highs reached in the early 1980’s.
The chart on the right is the Nasdaq 100, looking back to the early 1990s. The Dot-com bubble peaked in 2000 and tech stocks then proceeded to fall 90% in value over the next few years (nearly the same percentage as silver’s decline). Turning the page forward, the tech-stock rally over the past few years, has pushed it back to the levels it hit, at the Dot-com highs in 2000.
Last year, tech stocks had the chance to break above 2000 highs and at this time, looks to have failed. Now it appears that the NDX created a “Double Top” 15 years later. Sellers stepped in when silver double topped 30 years later, will sellers do the same in the NDX?
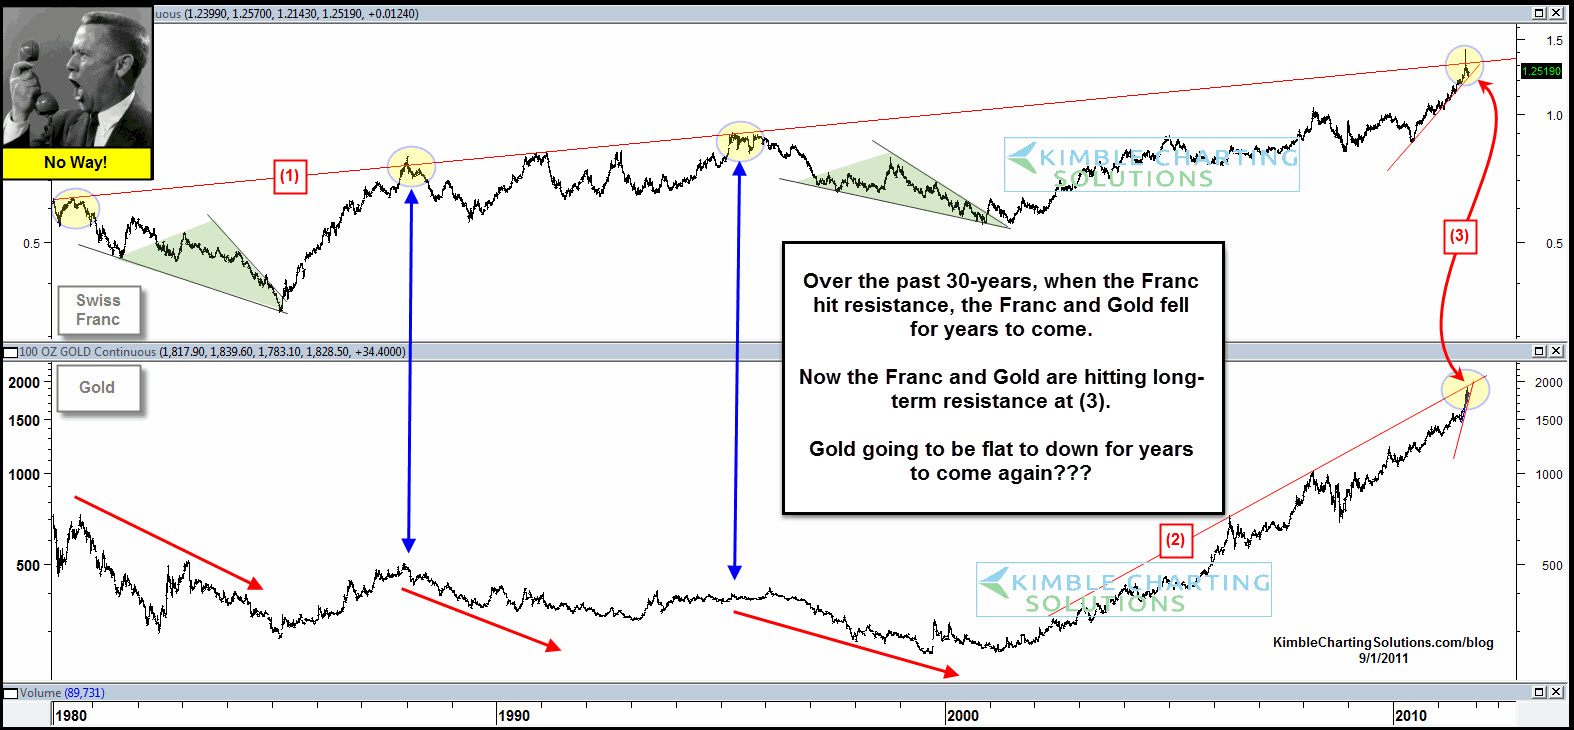
The Power of the Pattern in 2011 suggested that metals could fall for years to come, due to the double top in silver and a topping pattern in the Swiss franc.
If this is a “Double Top” in tech stocks, will they decline as much as silver did? Humbly that is a great question, that will take some time to answer. We do know this; a potential double top in tech could be in place and support is breaking. Billions of free thinking people matter and how much selling could take place, is impossible to predict.
Due to this pattern in the NDX, Premium members are short the NDX, owning (N:PSQ).
It took silver around 11 years to rally from its 2000 lows to 2011 highs, to create the double top. The NDX has rallied strongly for the past 11 years (2003 lows to 2015 highs), which took it back to its 2000 highs. No one knows how much selling pressure will or won’t take place in the future. I suspect many doubted that silver could fall 65% in 4 years back in 2011.
The pattern in silver and the NDX is NOT an exact repeat, though some things do look familiar. Odds are low that the NDX, follows silver's pattern exactly.
The impact would be big if it does. Caution friends


