Get 40% Off
⚠ Earnings Alert! Which stocks are poised to surge?
See the stocks on our ProPicks radar. These strategies gained 19.7% year-to-date.
Unlock full list

Will Facebook Shares Continue Marching North?

Published 01/27/2021, 07:26 AM
Updated 07/09/2023, 06:31 AM

Facebook (NASDAQ:FB) traded higher yesterday, breaking above the resistance (now turned into support) barrier of 280.50, marked by the high of Dec. 29. Overall, the broader path appears to be to the sideways on the daily chart, but since Jan. 15, the stock has been in a recovery mode. Thus, with nothing pointing otherwise, we would see the case for the recover to continue for a while more.

Having said that though, a lot of the stock’s forthcoming direction may depend on the firm’s earnings report, scheduled to be released today, after the US closing bell. Despite the traffic surging due to the coronavirus pandemic keeping people at home, critics say that the company has failed to take necessary actions to stop hate speech and posts advocating political violence. Market participants may be on the lookout of how this may have affected earnings in Q4 2020, with analysts predicting that EPS will rise sharply, but at a slower pace than the previous quarters of 2020. Another metric to which investors may pay extra attention to is the monthly active users, a major driver for advertisement revenue.

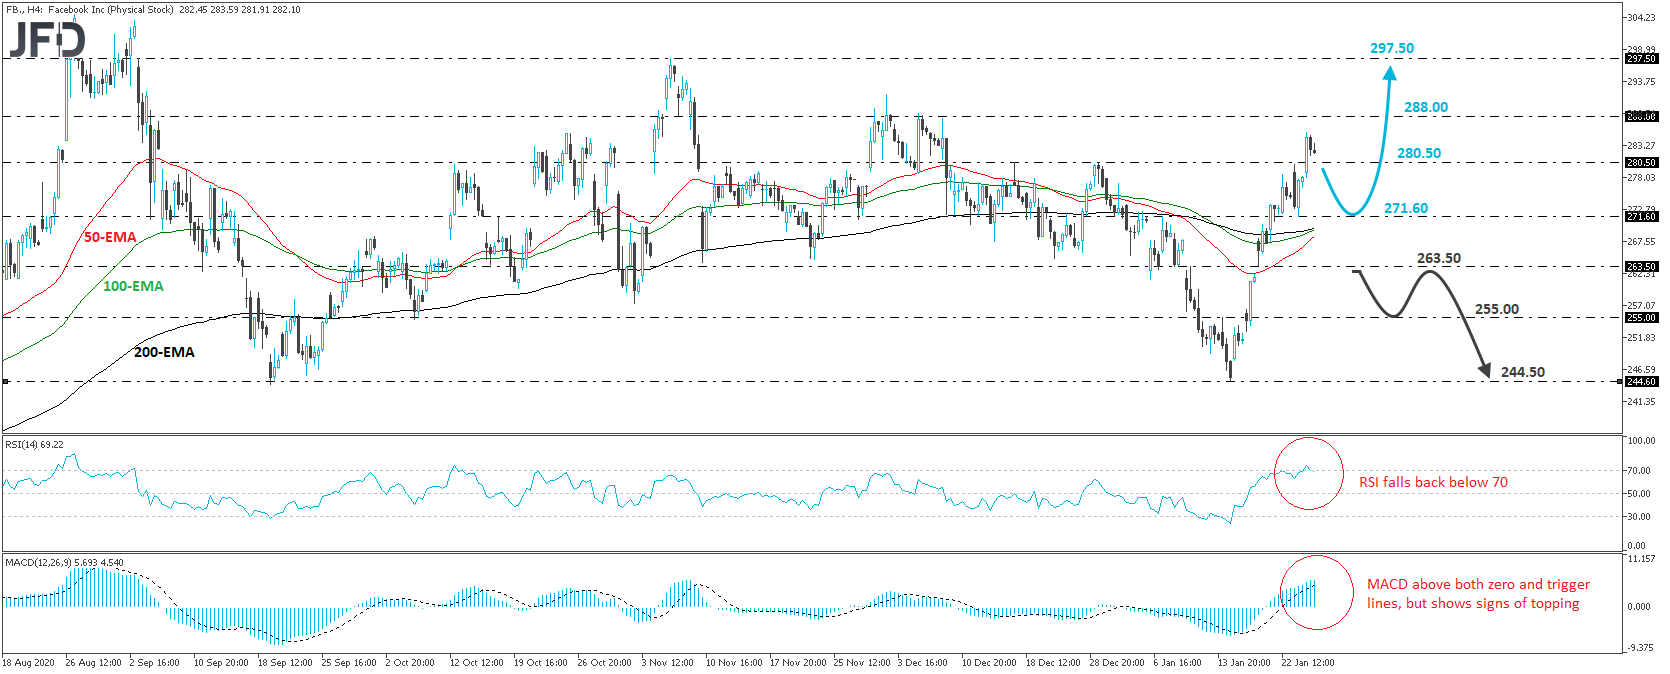
Upbeat results may allow the stock to continue its recovery mode, perhaps initially targeting the high of Dec. 9, at around 288.00. If that zone fails to provide resistance, its break may carry larger bullish implications, perhaps paving the way towards the peak of Nov. 5, at around 297.50.

That said, our short-term oscillators suggest that a small retreat may be in the cards before the next leg north. The RSI has just exited its above-70 zone and continues to point down, while the MACD, although above both its zero and trigger lines, shows signs of topping as well.

Now, in order to totally abandon the bullish case, we would like to see a decent dip below 263.50. This will drive the share price below all three of our moving averages on the 4-hour chart and may initially open the path towards the 255.00 area, marked as a support by the inside swing high of Jan. 14. Another break, below 255.00, could set the stage for the low of that day, at around 244.60.
Facebook stock 4-hour chart technical analysis

Latest comments

Risk Disclosure: Trading in financial instruments and/or cryptocurrencies involves high risks including the risk of losing some, or all, of your investment amount, and may not be suitable for all investors. Prices of cryptocurrencies are extremely volatile and may be affected by external factors such as financial, regulatory or political events. Trading on margin increases the financial risks.
Before deciding to trade in financial instrument or cryptocurrencies you should be fully informed of the risks and costs associated with trading the financial markets, carefully consider your investment objectives, level of experience, and risk appetite, and seek professional advice where needed.
Fusion Media would like to remind you that the data contained in this website is not necessarily real-time nor accurate. The data and prices on the website are not necessarily provided by any market or exchange, but may be provided by market makers, and so prices may not be accurate and may differ from the actual price at any given market, meaning prices are indicative and not appropriate for trading purposes. Fusion Media and any provider of the data contained in this website will not accept liability for any loss or damage as a result of your trading, or your reliance on the information contained within this website.
It is prohibited to use, store, reproduce, display, modify, transmit or distribute the data contained in this website without the explicit prior written permission of Fusion Media and/or the data provider. All intellectual property rights are reserved by the providers and/or the exchange providing the data contained in this website.
Fusion Media may be compensated by the advertisers that appear on the website, based on your interaction with the advertisements or advertisers.
© 2007-2024 - Fusion Media Limited. All Rights Reserved.