
Value investing is easily one of the most popular ways to find great stocks in any market environment. After all, who wouldn’t want to find stocks that are either flying under the radar and are compelling buys, or offer up tantalizing discounts when compared to fair value?
One way to find these companies is by looking at several key metrics and financial ratios, many of which are crucial in the value stock selection process. Let’s put AXA S.A. (OTC:AXAHY) stock into this equation and find out if it is a good choice for value-oriented investors right now, or if investors subscribing to this methodology should look elsewhere for top picks:
PE Ratio
A key metric that value investors always look at is the Price to Earnings Ratio, or PE for short. This shows us how much investors are willing to pay for each dollar of earnings in a given stock, and is easily one of the most popular financial ratios in the world. The best use of the PE ratio is to compare the stock’s current PE ratio with: a) where this ratio has been in the past; b) how it compares to the average for the industry/sector; and c) how it compares to the market as a whole.
On this front, AXA has a trailing twelve months PE ratio of 11.66. This level compares pretty favorably with the market at large, as the PE ratio for the S&P 500 comes in at about 20.50.
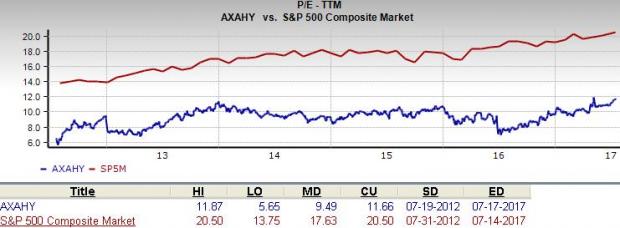
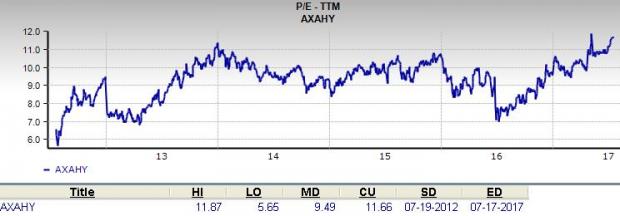
If we focus on the long-term trend of the stock the current level puts AXA’s current PE among its highs over the observed period, with the number having risen rapidly over the past few months. This suggests that the stock is overvalued compared to its own historical levels.
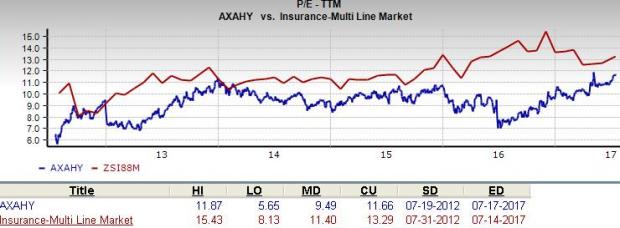
Further, the stock’s PE compares favorably with the Zacks classified Insurance – Multi Line industry’s trailing twelve months PE ratio, which stands at 13.29. At the very least, this indicates that the stock is relatively undervalued right now, compared to its peers.
We should also point out that AXA has a forward PE ratio (price relative to this year’s earnings) of just 10.25 – which is lower than the current level. So it is fair to say that a slightly more value-oriented path may be ahead for AXA stock in the near term too.
PS Ratio
Another key metric to note is the Price/Sales ratio. This approach compares a given stock’s price to its total sales, where a lower reading is generally considered better. Some people like this metric more than other value-focused ones because it looks at sales, something that is far harder to manipulate with accounting tricks than earnings.
Right now, AXA has a P/S ratio of about 0.63. This is lower than the Zacks categorized Insurance – Multi Line industry average, which comes in at 1.34 right now.
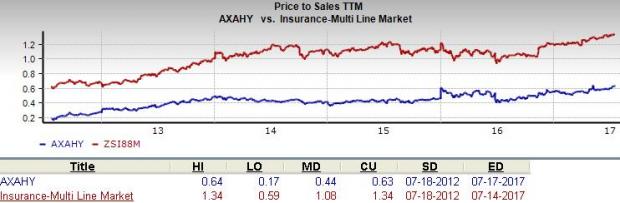
AXAHY is actually in the higher zone of its trading range in the time period per the P/S metric, which suggests that the company’s stock price has already appreciated to some degree, relative to its sales.
Broad Value Outlook
In aggregate, AXA currently has a Zacks Value Style Score of ‘B’, putting it into the top 40% of all stocks we cover from this look. This makes AXA an apt choice for value investors, and some of its other metrics make it pretty clear too.
For example, its P/B ratio (used to compare a stock's market value to its book value) stands at 0.84, lower than the industry average of 1.03. Clearly, AXAHY is a solid choice on the value front from multiple angles.
What About the Stock Overall?
Though AXA might be a good choice for value investors, there are plenty of other factors to consider before investing in this name. In particular, it is worth noting that the company has a Growth grade of ‘F’ and a Momentum score of ‘A’. This gives AXAHY a Zacks VGM score—or its overarching fundamental grade—of ‘C’. (You can read more about the Zacks Style Scores here >>)
Meanwhile, the company’s recent earnings estimates have been trending upwards lately. The current year has seen one estimate go higher in the past thirty days compared to none lower, while the next year estimate has seen one upward revision and no downward revisions in the same time period.
This has had just a small impact on the consensus estimate though as the current year consensus estimate has risen by 4.4% in the past month, while the next year estimate has increased 4.6%. You can see the consensus estimate trend and recent price action for the stock in the chart below:
Asa SA Price and Consensus
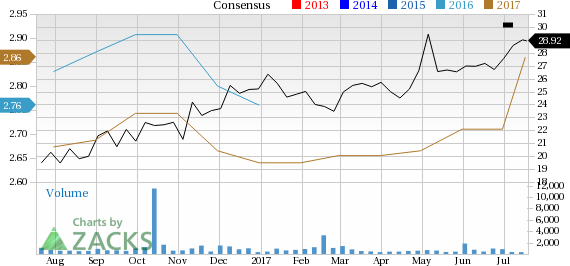
This positive trend signifies bullish analyst sentiment, and its Zacks Rank #2 (Buy) indicates robust fundamentals and expectations of outperformance in the near term.
Bottom Line
AXA is an inspired choice for value investors, as it is hard to beat its incredible lineup of statistics on this front.
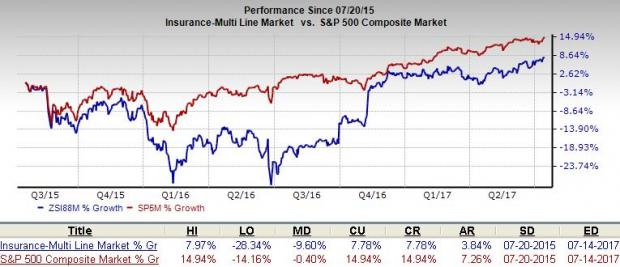
However, despite a strong Zacks Rank, the sluggish industry rank (among the Bottom 17%) somewhat dims the sparkle. In fact, over the past two years, the Zacks Insurance – Multi Line industry has clearly underperformed the broader market, as you can see below:
Nevertheless, putting together the top Zacks Rank, positive estimate revisions and robust value metrics, we believe that we have a strong value contender in AXA.
5 Trades Could Profit "Big-League" from Trump Policies
If the stocks above spark your interest, wait until you look into companies primed to make substantial gains from Washington's changing course.
Today Zacks reveals 5 tickers that could benefit from new trends like streamlined drug approvals, tariffs, lower taxes, higher interest rates, and spending surges in defense and infrastructure. See these buy recommendations now >>
Asa SA (AXAHY): Free Stock Analysis Report
Original post
Zacks Investment Research