Crude Oil Market Structure – Extremes in Speculative Net Long Positions
On May 28, markets were closed so this Report is coming out a day later than normal. The price of gold rose nine bucks, and the price of silver 4 pennies. With little action here, we thought we would write 1,000 words’ worth about oil. Here is a chart showing oil prices and open interest in crude oil futures.
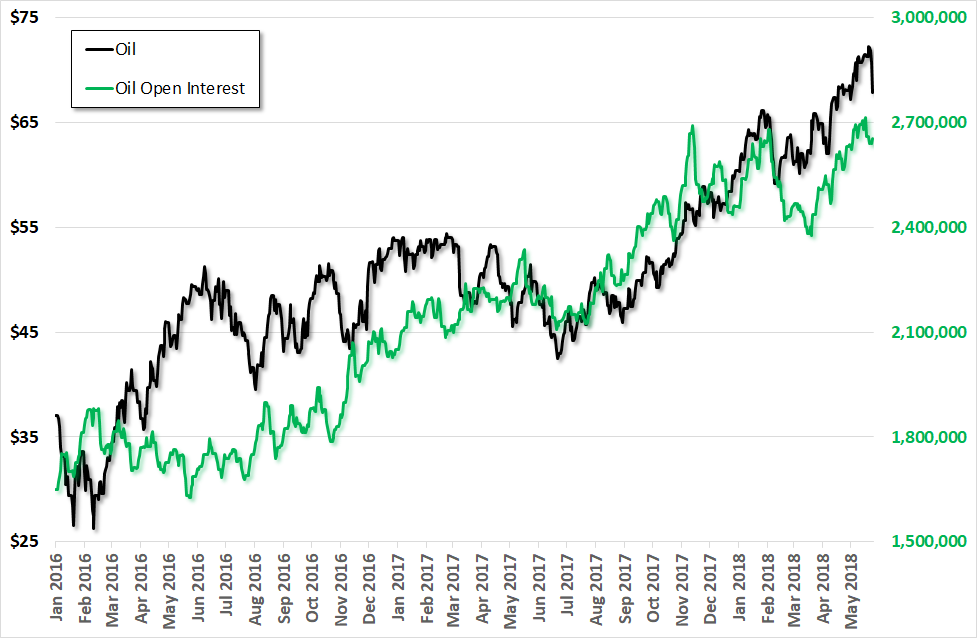
WTIC (West Texas Intermediate crude) price and futures open interest – the vast increase in OI was largely the result of a breathtaking surge in speculative buying. [PT]
We don’t track the oil basis (perhaps we should). However, as we have discussed in the past, open interest rises in response to a rising basis. That is, when speculators bid up the price of futures relative to the price of spot, it becomes more profitable to carry the item concerned. Unlike gold, oil has a significant cost to carry (it has to be stored, it is flammable and toxic, it can spoil with too much sun or oxygen, etc.).
However, the same thing is true for oil as for gold. A positive and rising basis attracts the marginal warehouseman (tanksman?) to buy spot and sell futures against it so as to profit from the basis.
Open interest was around 1.6 million contracts when oil was making its price low. Since then, the price has nearly tripled (not counting the price drop last week). At the same time, open interest has increased by nearly two thirds. We would wager an ounce of fine gold against a torn dollar bill that there has been a commensurate rise in the basis.
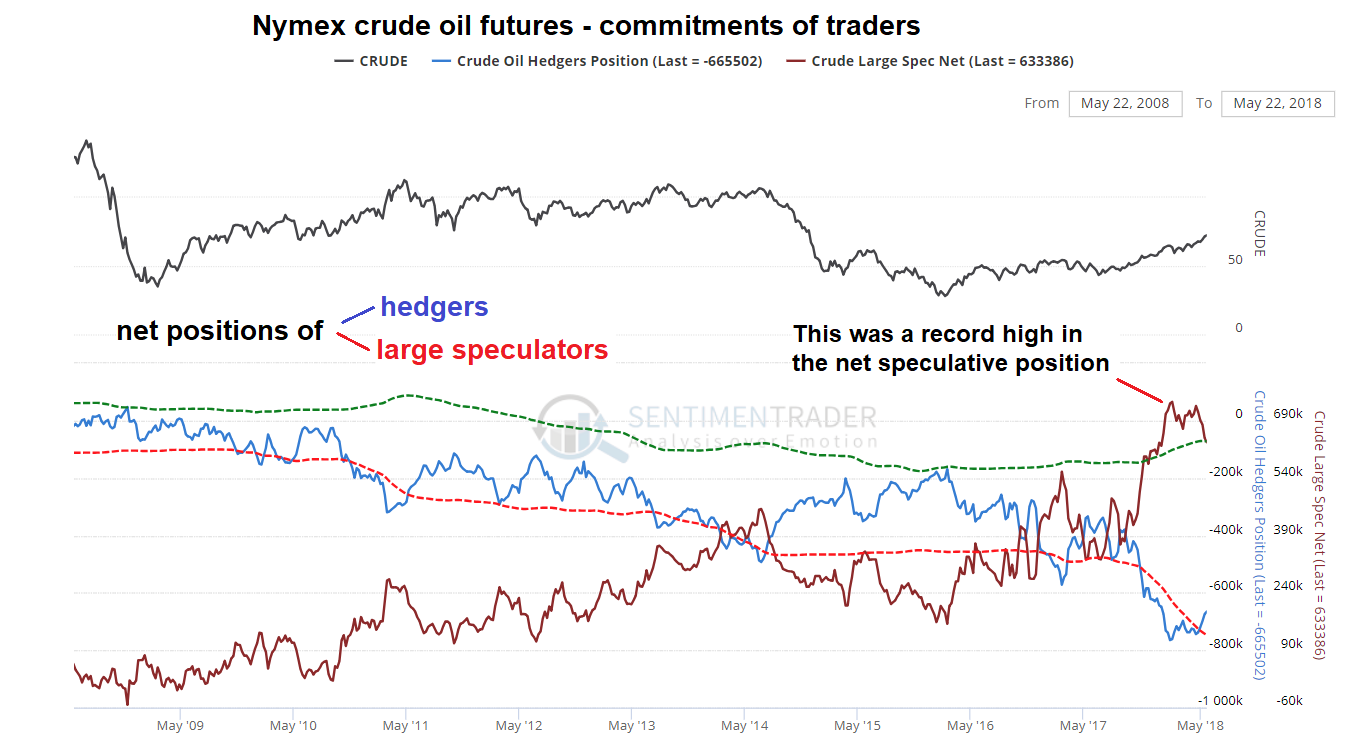
Commitments of traders in NYMEX crude oil futures – recently large speculators held the largest net long position in crude futures ever recorded, exceeding even the extremes seen in 2014 by a sizable margin. This is not bearish per se, but it does represent a huge amount of potential selling pressure that is likely to emerge with a vengeance at some point. Whether the most recent decline is meaningful or only another short term correction remains to be seen, but given this large market imbalance caution is definitely advisable.
Speculators actually enjoy a minor gain upon rolling their futures over at the moment, as the market is slightly in backwardation (it is very little in the nearer months, with the discount steepening noticeably in futures that are a year or further out – however, most of the open interest and trading volume is of course concentrated in the nearest expiration cycles). The flood of speculative buying in the near months was egged on by declining inventories, but as we have seen in 2014 – 2015, once the curve begins to flatten and threatens to go back into contango (which as a rule will tend to coincide with a reversal of the trend in inventories), speculators will turn on a dime and with their net long positions this large, their selling can quickly become relentless. [PT]
A price that has risen due to and along with a rise in the basis is not going to remain high. All that quantity of the good has gone into warehouses (tanks). When the marginal demand for warehousing (tanking) turns off and becomes instead the marginal supply, watch out.
We have no idea if this is the week for it, but it fits with the dramatic drop in interest rates. From May 18 to May 25, the 10-year Treasury yield fell from 3.11% to 2.93%. That may not sound like a lot, but in percentage terms the move is 5.8%. We have no idea if this is the decisive turn down interest rates, or if there is more upside action before that turn occurs. But we do know two things.
One, the long-term trend is still falling interest rates. Two, commodity prices correlate with (and are caused by) moves in interest rates. Rising rates cause rising prices, and falling rates cause falling prices for reasons spelled out in my Theory of Interest and Prices.
Fundamental Developments in Precious Metals
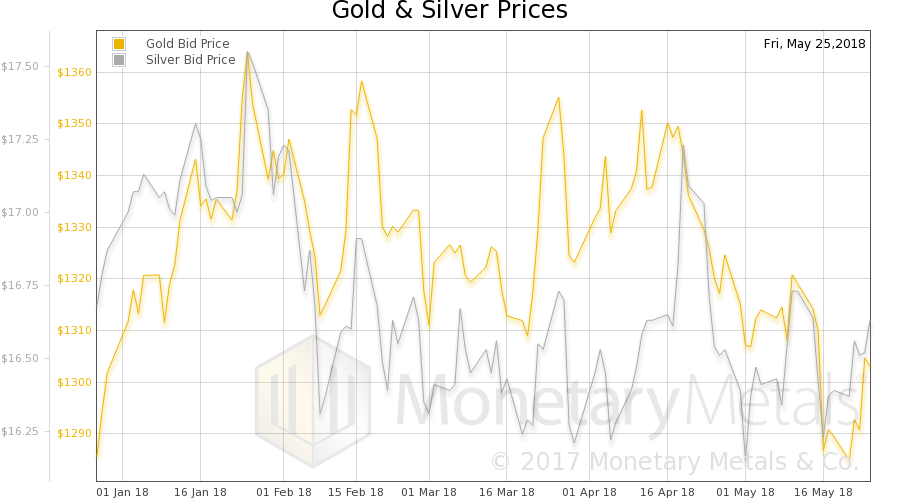
We will take a look at the fundamentals, not of oil, but of gold and silver. But first, here is the chart of the prices of gold and silver.
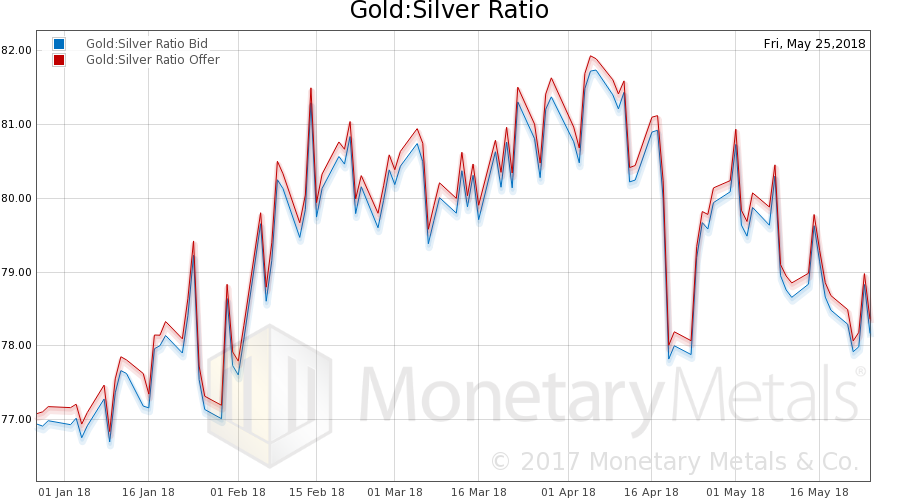
Next, this is a graph of the gold price measured in silver, otherwise known as the gold to silver ratio (see here for an explanation of bid and offer prices for the ratio). It rose a skosh this week.
Here is the gold graph showing gold basis, co-basis and the price of the dollar in terms of gold price.
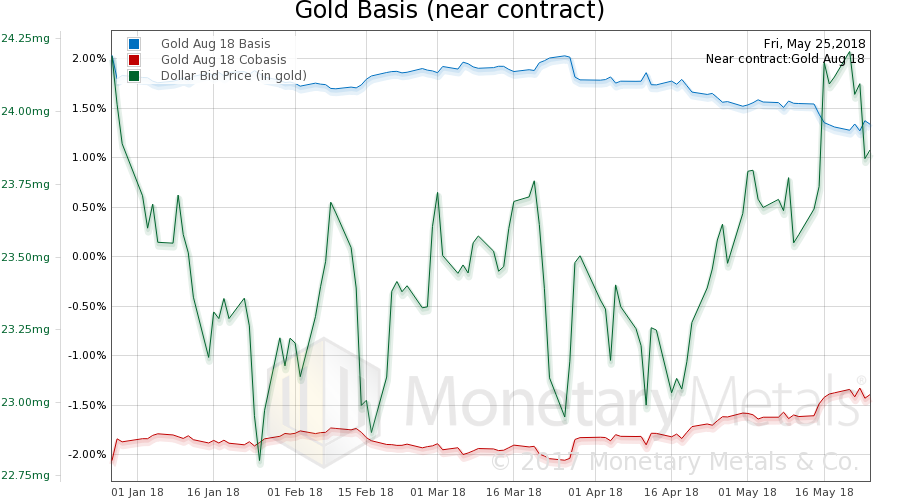
The price of gold rose this week, but its scarcity fell. The Monetary Metals Gold Fundamental Price fell $24 this week to $1,398.
Now let’s look at silver.
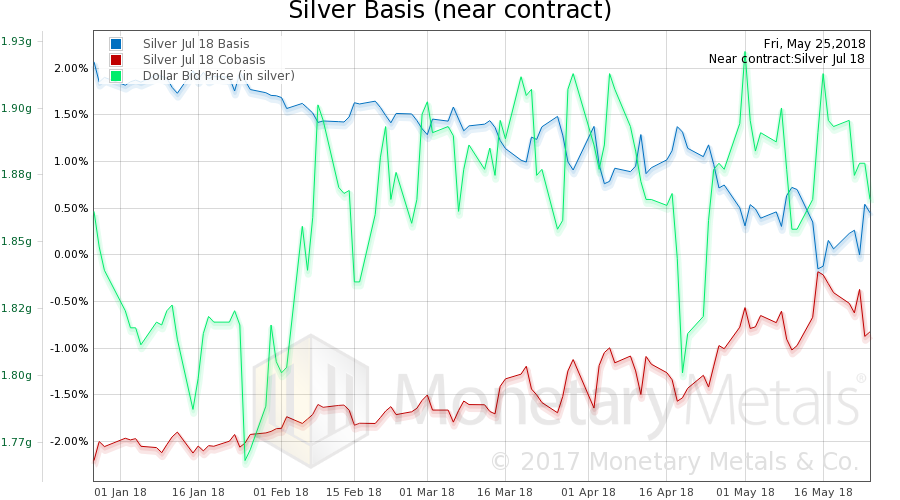
The same thing happened in silver, except the drop in scarcity was larger than in gold. And the price fell accordingly. The Monetary Metals Silver Fundamental Price fell 49 cents to $17.43.
