Every day in the new Morpheus Swing Trader Chatroom, we track the market live and have the ability to notify members of explosive stock breakouts as they happen in real-time.
The live trading room is a fantastic place to learn a winning swing trading strategy, especially for new traders.
It’s also quite helpful for traders who are simply looking for an extra set of eyeballs to help generate profitable stock trading ideas during the day (no daytrading, no hype).
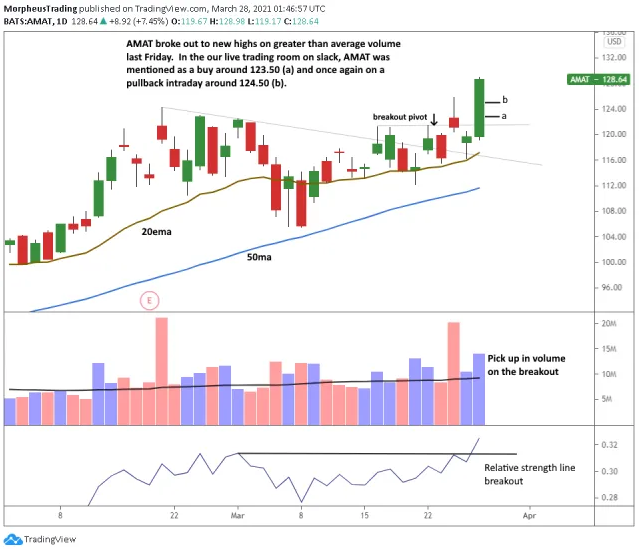
On the morning of Mar. 26, semiconductor stock Applied Materials (NASDAQ:AMAT) moved through its original breakout pivot and triggered a valid buy entry.
We mentioned the AMAT breakout in the swing trader chatroom at 9:47 am ET, while the stock was trading near the $123.50 level.
For members who missed the initial buy entry, we also called out a pullback buy entry around 11:00 am ET (near the $124.50 area).
By the close, Applied Materials was 4% above the initial breakout entry and 3% higher than the pullback entry.
We liked AMAT due to its tight trading range above the rising 50-day moving average, with the price action hugging the rising 20-day EMA the past few weeks.
The Mar. 26 breakout in AMAT was confirmed by a pick-up in volume, which finished well above its average level (a bullish sign of institutional accumulation).
The daily chart below shows the setup at the end of the breakout day:

The Mar. 26 breakout in AMAT was also a rally to fresh all-time highs.
As explained in 3 Proven Ways to Know When Stocks may be Forming a Significant Bottom, stocks that rally to new highs, while the NASDAQ is in correction mode, often become the next leadership stocks when the bull market returns.
The relative strength line (bottom panel on the chart above) plots the daily price of AMAT vs. the S&P 500 Index.
It was bullish that the price and relative strength moved in sync to new highs.
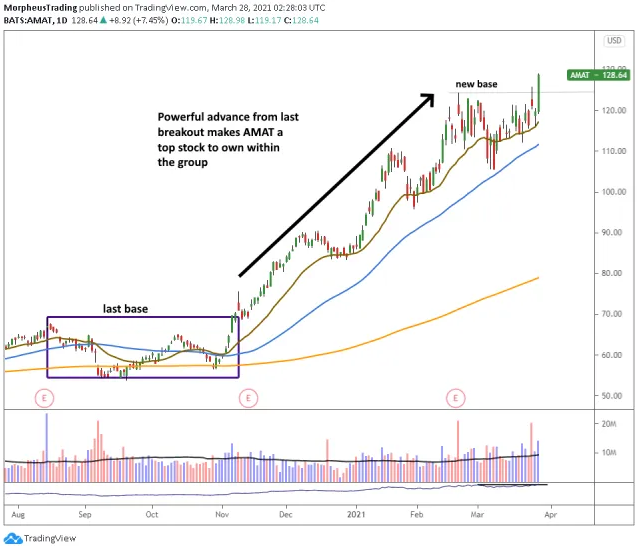
The price action that followed the previous breakout was also a big clue that the stock had leadership potential.
Below, notice the strong uptrend after the last breakout led to a gain of +80% in just a few months:

Applied Materials is easily one of the top, highly liquid movers in the semiconductor sector.
AMAT also boasts strong IBD ratings, a key element of any CAN SLIM-based trading strategy:
IBD Ratings for $AMAT
- Relative Strength Rating 91 (now) was > than 80 prior to breakout
- EPS rating – 94
- Composite Rating – 99
- Accumulation/Distribution Rating – A
- Up/Down volume ratio – 1.5
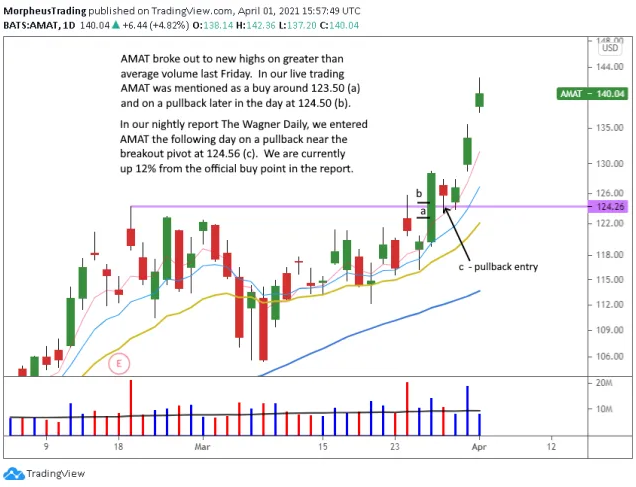
As shown on the daily chart below, Applied Materials is following through nicely on last week’s breakout.
Currently, AMAT is showing a gain of +15% since the breakout entry in Morpheus Swing Trader Chatroom:

The explosive gains we were seeing in leading growth stocks earlier this year may be limited in the current environment.
Nevertheless, we are again starting to see profitable opportunities for new leadership stocks with relative strength to the market.
Since recently shifting out of cash and back into growth stocks, the model portfolio of our swing trading report is also long Lam Research (NASDAQ:LRCX) and Denbury Resources (NYSE:DEN) with gains of +7% and +13% respectively.
