Selling options (covered call writing and selling cash-secured puts) will result in a positive outcome in the first four of the following five scenarios:
- Stock price moves up significantly
- Stock price moves up slightly
- Stock price remains the same
- Stock price moves down slightly (less than option premium)
- Stock price moves down substantially
Although it is important to enhance gains in the first four situations, it is critical we learn how to mitigate losses when the stock price is declining significantly. Because the BCI approach to selling calls is slightly different than how we approach puts, the 3% guideline will have application for put-selling only. Let’s first define the 3% guideline for put-selling:
If share price drops below the out-of-the-money put strike (lower than current market value) we sold and the stock is under-performing the overall market, we buy back that put option.
This is a defensive maneuver used to avoid catastrophic losses. Generally, closing this put position will result in a net debit because put value increases as share price decreases. Our goal is to keep loses small and then use the cash now freed up to secure another put position with a different underlying security.
Example of the 3% guideline for put-selling
- Stock price = $51
- Sell the $50 out-of-the-money put for $1.50
- Share price declines to $48.00, 4% below the $50.00 strike
- Buy-to-close the short put which has an intrinsic value of $2.00 plus a time value component. Let’s say a total cost-to-close of $2.50
- Net debit = $1.00 and the now “freed-up” cash can be used to secure a different put position in an attempt to mitigate the $1.00 loss
Reasons why the 3% guideline is an asset when selling puts
In the BCI methodology, we select mainly out-of-the-money puts to generate monthly cash flow. The reason we sell puts is to avoid taking possession of the stock. If we sold near-the-money or in-the-money put strikes, the chances of exercise are much greater defeating the purpose of favoring puts over calls. There are exceptions to this rule. For example, when puts are sold in lieu of setting limit orders to buy a stock at a discount, near-the-money or in-the-money strikes are given more consideration.
Also, if we set goals for initial profit to be in the 2-4% range, targeting a 3% below strike price is reasonable to avoid catastrophic losses. It is true we usually will incur a net debit after closing the short put, but it will be a manageable loss.
Strike selection for covered call writing
With this strategy, we already own the stock prior to selling the call option. This means that in-the-money, near-the-money and out-of-the-money strikes are all in play. The 3% guideline may work for most in-the-money strikes since we collect intrinsic premium when we sell the initial in-the-money call. This will mitigate some of the share price loss when the stock is sold. However, if we sell out-of-the money call strikes the stock price may already be 3% below that strike or close to it.
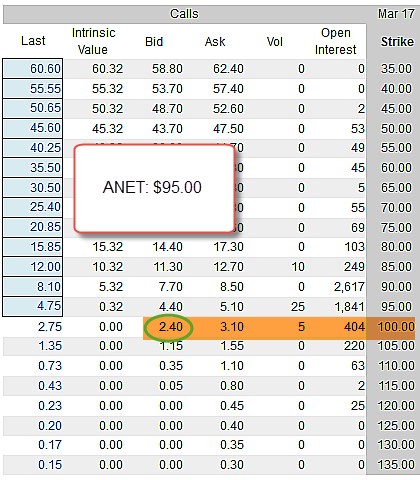
Real-life example with ANET ($95.00)

With ANET trading at $95.00, the out-of-the-money $100.00 strike generates a premium of $2.40 resulting in a 2.53% initial 6-week profit. If we instituted a 3% guideline, the trade would not be permitted because the stock would have to be sold at $97.00, 3% below the $100.00 strike.
Discussion
The 3% guideline has near universal application when selling puts but not when writing covered calls. The reasons relate to strike price selection differences, willingness to own the underlying security and strategy goals.
Market tone
Global stocks moved up impressively this week. The price of West Texas Intermediate crude oil moved up to $46.35 a barrel from $44.50 a week ago. Volatility, as measured by the Chicago Board Options Exchange Volatility Index (VIX), dropped to 9.51 from 11.75 last week. This week’s economic and international news of importance:
- US Federal Reserve chair Janet Yellen testified on monetary policy before the House Financial Services Committee this week as markets continued to digest the Fed’s recently announced balance sheet reduction plans
- Chair Yellen reiterated that the Fed expects a tightening labor market to lead to increased inflation. Last month, the central bank raised rates for the third time since December 2016
- China’s consumer price index was reported at 1.5%, missing a 3% target. Its producer price index was reported at 5.5%, which was in line with expectations. The slowdown in inflation is consistent with the slowdown in inflation in the US and many other countries
- The G-20 summit of leaders of major economies concluded in Hamburg, Germany this week after discussions on a broad range of topics, including trade, climate change and immigration policy. Many leaders attending the summit appeared at odds with US president Donald Trump, particularly over trade policy and climate change
- The Bank of Canada raised rates by a quarter of a percentage point to .75%
- US retail sales were down .2% month over month, with six of the 16 categories falling into negative territory
THE WEEK AHEAD
Monday, July 17th
- Eurozone: Consumer price index
Wednesday, July 19th
- Japan Policy rate
- Housing starts
Thursday, July 20th
- Continuing jobless claims
- Eurozone: Flash consumer confidence indicator
- United Kingdom: Retail sales
Friday July 21st
- Canada: Consumer price index
Summary
IBD: Market in confirmed uptrend
GMI: 5/6- Buy signal since market close of July 13, 2017
BCI: I am fully invested in the stock portion of my portfolio currently holding an equal number of in-the-money and out-of-the-money strikes. Leaning to moving to a more bullish position when the August contracts begin.
WHAT THE BROAD MARKET INDICATORS (S&P 500 AND CBOE Volatility Index) ARE TELLING US
The 6-month charts point to a bullish outlook. In the past six months, the S&P 500 was up 8% while the VIX (11.19) moved down by 20%.
Much success to all,
