Get 40% Off
🚨 Volatile Markets? Find Hidden Gems for Serious OutperformanceFind Stocks Now

Why Oil Should Be Supported In Weekly Chart

Published 01/11/2018, 04:50 AM
Updated 03/09/2019, 08:30 AM

Hello fellow traders, in this blog post, we will discuss oil in a more bigger picture.

In the chart below, you can see crude oil futures on the weekly chart.

From the 02/08/2016 low, we can clearly see that the market has a potential 5 swing incomplete bullish sequence. It seems like that it is still in the fifth swing. The weekly target for us is between 68.53-86.82. Please note a 5 swing sequence is different than 5 waves impulse. Overall, we can conclude that we need more upside in oil and we suggest members to buy the instrument in 3-7-11 swings to the upside.

Oil Weekly Chart
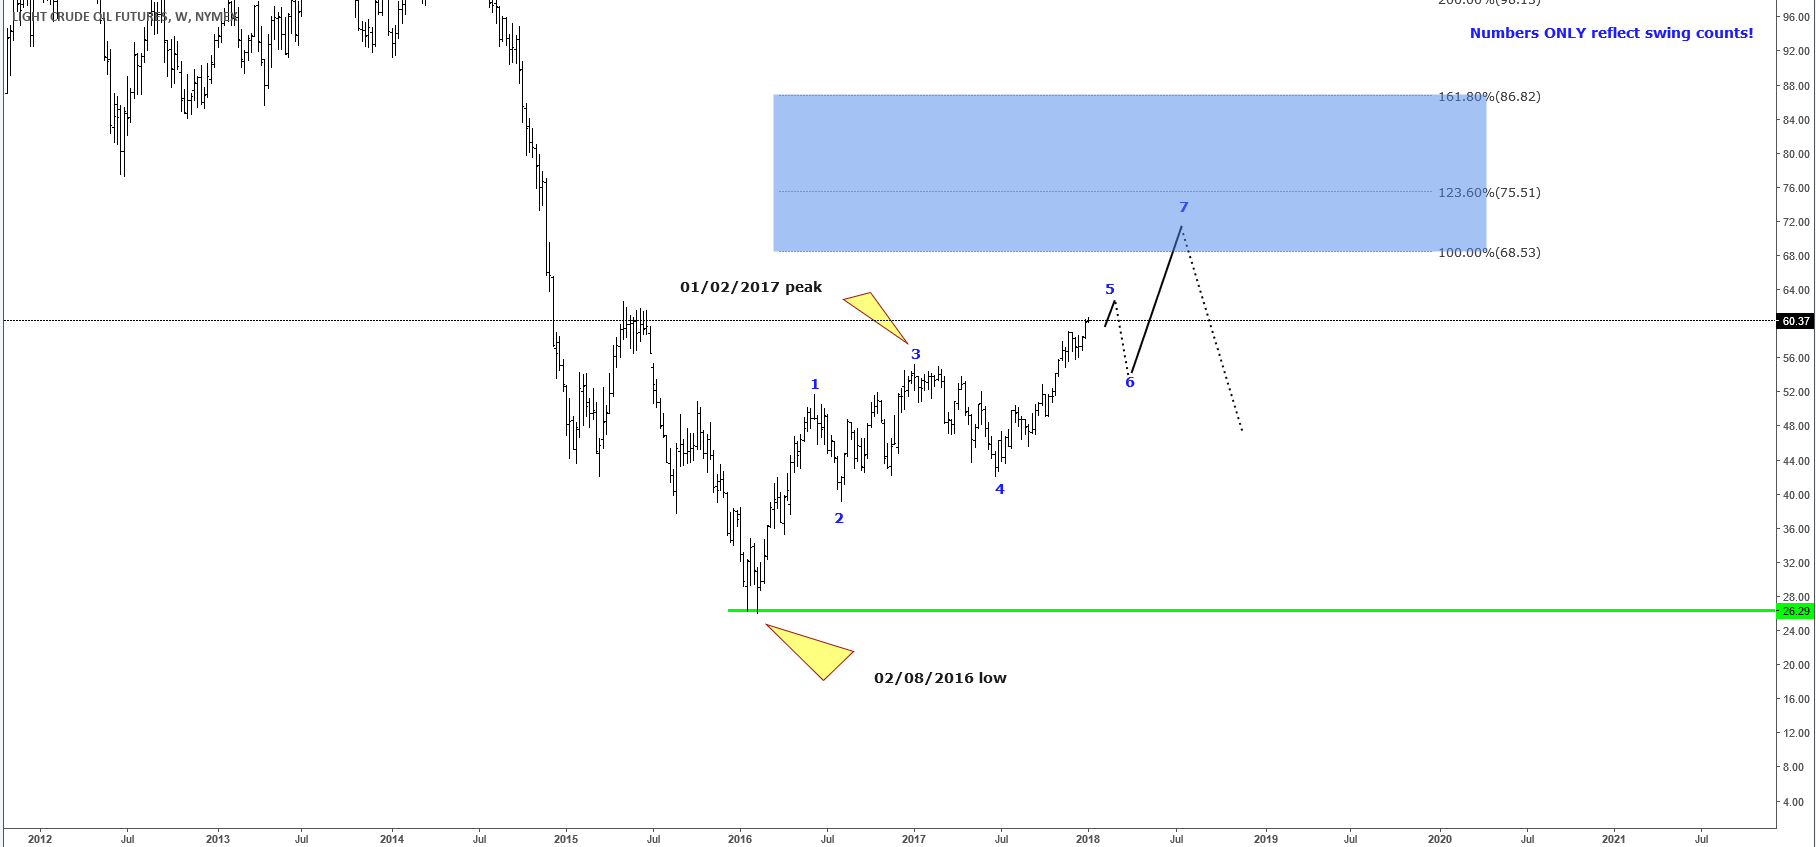
Crude Oil Weekly Chart

With that said I want to present to you another important instrument we follow. It is called the Wisdomtree Continuous Commodity Index (GCC).
The GCC is basically a basket of diversified different commodity exposure. In the image below you can see the different components of the index.

GCC Components

GCC Components
Source: https://www.wisdomtree.com/etfs/alternative/gcc

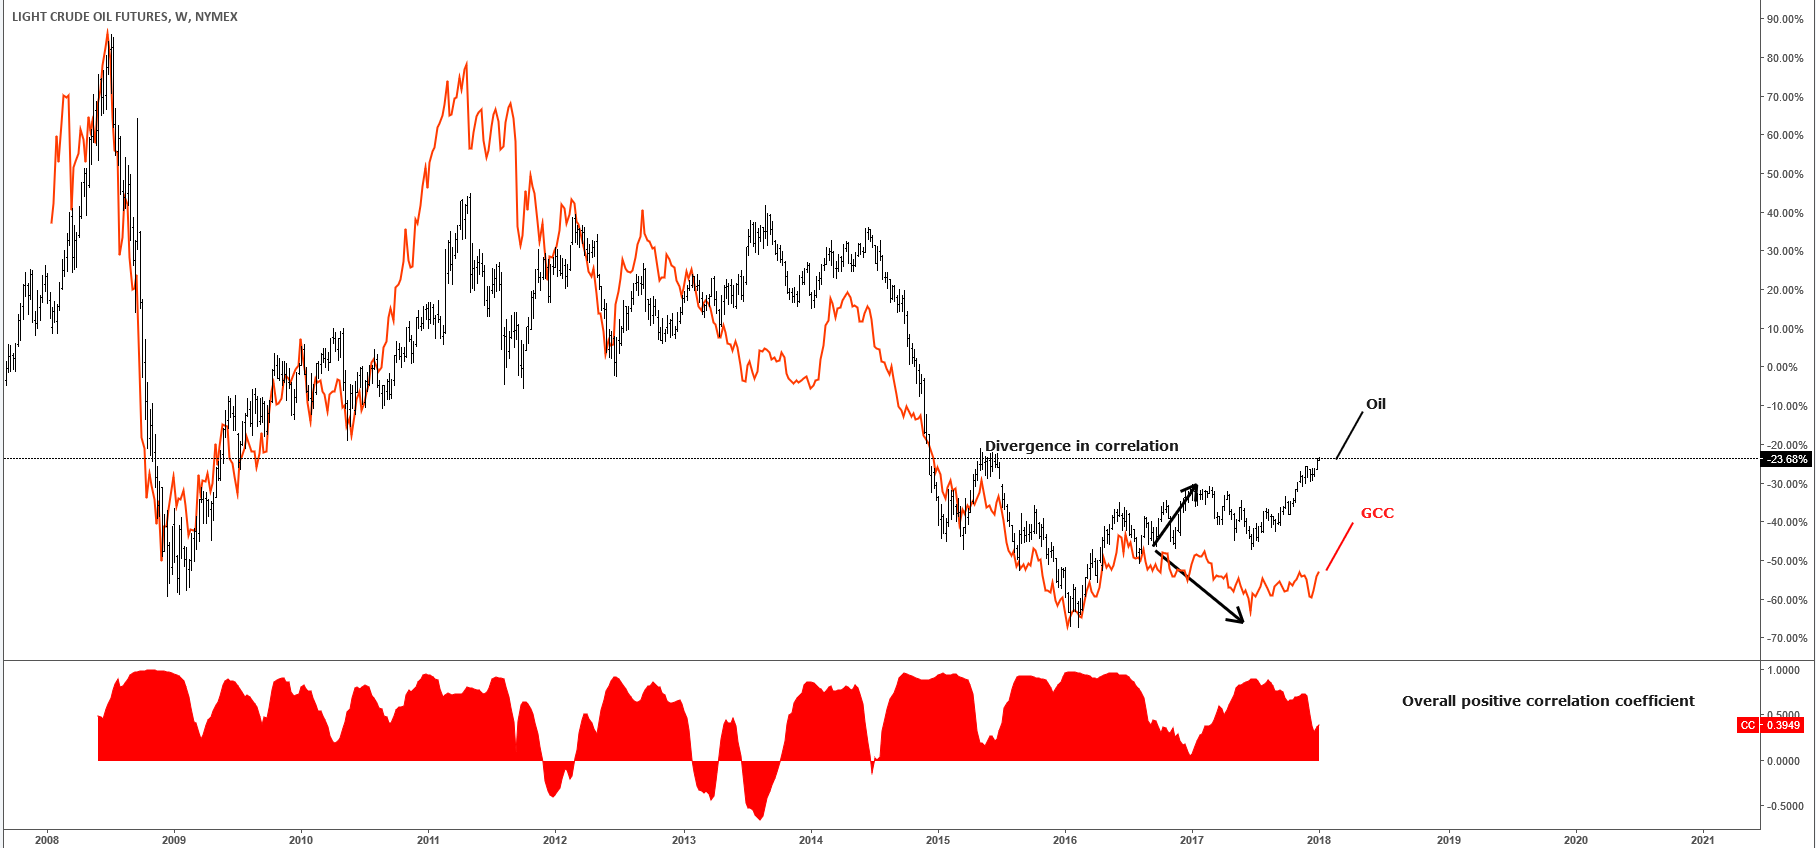
But why do we need the GCC to forecast crude you might ask yourself. Well, that’s pretty easy to answer. Please have a look at the chart below. You can see the crude chart simply overlayed with the GCC index. You can clearly see, that both markets are correlating big time. Obviously, we need to understand that correlation is never pip by pip. This means that we have times where both the markets are diverging to each other. As you can see in in the arrows below. Oil is going higher whereas the GCC made new lows. But that doesn’t change the overall degree of correlation.

3rd party Ad. Not an offer or recommendation by Investing.com. See disclosure here or remove ads .

Oil vs GCC
Oil Vs. GCC Chart

Now let’s have a look at the GCC chart below. You can see that the market never broke above 07/04/2017, whereas oil broke the high. However, from the 06/19/2017 low, the GCC has, in fact, a bullish sequence, targeting the area of 19.89-20.85. Which makes it bullish against that level. This means that oil will also continue higher in a longer-term perspective.

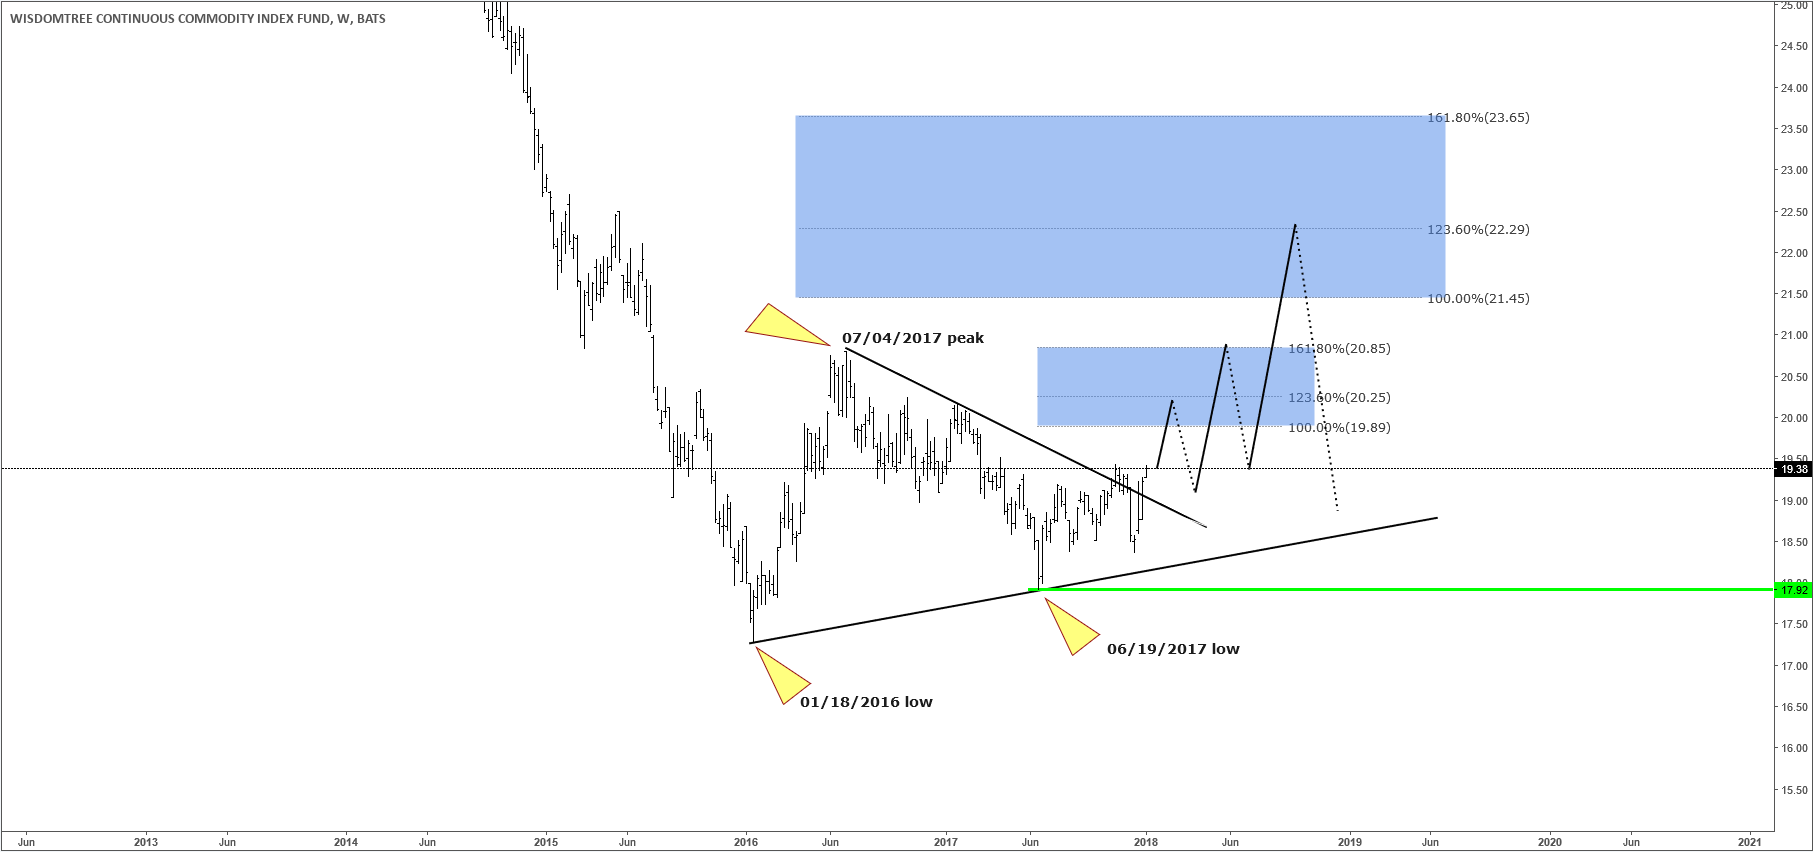
GCC Weekly Chart
GCC Weekly Chart

Latest comments

Risk Disclosure: Trading in financial instruments and/or cryptocurrencies involves high risks including the risk of losing some, or all, of your investment amount, and may not be suitable for all investors. Prices of cryptocurrencies are extremely volatile and may be affected by external factors such as financial, regulatory or political events. Trading on margin increases the financial risks.
Before deciding to trade in financial instrument or cryptocurrencies you should be fully informed of the risks and costs associated with trading the financial markets, carefully consider your investment objectives, level of experience, and risk appetite, and seek professional advice where needed.
Fusion Media would like to remind you that the data contained in this website is not necessarily real-time nor accurate. The data and prices on the website are not necessarily provided by any market or exchange, but may be provided by market makers, and so prices may not be accurate and may differ from the actual price at any given market, meaning prices are indicative and not appropriate for trading purposes. Fusion Media and any provider of the data contained in this website will not accept liability for any loss or damage as a result of your trading, or your reliance on the information contained within this website.
It is prohibited to use, store, reproduce, display, modify, transmit or distribute the data contained in this website without the explicit prior written permission of Fusion Media and/or the data provider. All intellectual property rights are reserved by the providers and/or the exchange providing the data contained in this website.
Fusion Media may be compensated by the advertisers that appear on the website, based on your interaction with the advertisements or advertisers.
© 2007-2024 - Fusion Media Limited. All Rights Reserved.