
A month has gone by since the last earnings report for Verisk Analytics, Inc. (NASDAQ:VRSK) . Shares have lost about 1.2% in that time frame.
Will the recent negative trend continue leading up to its next earnings release, or is VRSK due for a breakout? Before we dive into how investors and analysts have reacted as of late, let's take a quick look at its most recent earnings report in order to get a better handle on the important catalysts.
Verisk Tops Q1 Earnings on Robust Organic Growth
Verisk Analytics reported impressive first-quarter 2018 results surpassing the Zacks Consensus Estimate on both counts.
Adjusted earnings per share of 94 cents outpaced the consensus mark by a penny and increased 27% year over year. Earnings were driven by strong organic growth, 2017 tax reform, contributions from acquisitions and lower share count, partially offset by increased depreciation and amortization, and interest expenses.
Total revenues of $581.2 million exceeded the consensus estimate by $16 million. The reported figure improved 15.6% year over year on a reported basis and 7% on an organic constant-currency basis.
Segmental Performance
Insurance segment revenues came in at $412.6 million, up 12.5% year over year on a reported basis and 8.7% on an organic constant-currency basis.
Within this segment, underwriting & rating revenues of $280.6 million was up 10.8% on a reported basis and 6.9% on an organic constant-currency basis. The improvement was primarily driven by strength in the company’s catastrophe modeling services and underwriting solutions. Claims revenues of $132 million improved 16.1% on a reported basis and 12.6% on an organic constant-currency basis. The uptick can be attributed to revenues from repair cost estimating solutions and claims analytics.
As energy business` end market continues to stabilize, Energy and Specialized Markets segment revenues were up 18.1% in the first quarter and 3.1% on an organic constant currency basis.
Revenues at the Financial Services segment increased 46.2% on a reported basis and 1.5% on an organic constant-currency basis. Strength across analytical products and media effectiveness solutions led to this improvement.
Operating Performance
Operating income of $194.5 million increased 3.6% year over year. Operating margin of $33.5% contracted 390 basis points (bps) year over year.
EBITDA of $268.8 million increased 9.4% year over year on a reported basis and 7.4% on an organic constant-currency basis. Organic EBITDA margin of 49% contracted 10 bps from the year- ago level.
EBITDA expenses (cost of revenues; selling, general and administrative expenses; investment income and others) increased 21.6% in the quarter under review and 6.7% on an organic constant-currency basis. The year-over-year organic constant currency increase was primarily driven by increased salaries and benefits associated with innovation and business growth.
Balance Sheet and Cash Flow
Verisk Analytics exited the quarter with cash and cash equivalents balance of $149.8 million, up from $142.3 million in the fourth quarter of 2017. Long term debt was $2 billion down from $2.3 billion in the last report.
Net cash flow from operating activities was $327 million, up 2.9% from the prior quarter. Free cash flow was $283.8 million, up 1% sequentially.
The company repurchased 0.4 million shares for $40 million. As of Mar 31, 2018, the company had $326 million worth of shares remaining under its share repurchase authorization.
How Have Estimates Been Moving Since Then?
In the past month, investors have witnessed an upward trend in fresh estimates. There have been five revisions higher for the current quarter
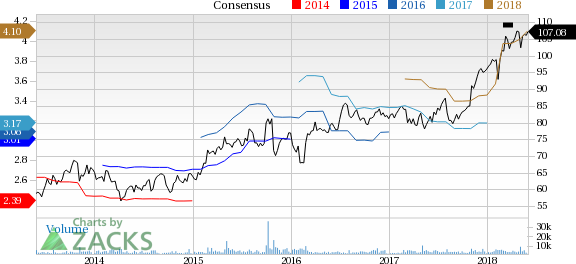
Verisk Analytics, Inc. Price and Consensus
VGM Scores
At this time, VRSK has an average Growth Score of C, however its Momentum is doing a bit better with a B. However, the stock was allocated a grade of D on the value side, putting it in the bottom 40% for this investment strategy.
Overall, the stock has an aggregate VGM Score of C. If you aren't focused on one strategy, this score is the one you should be interested in.
Our style scores indicate that the stock is more suitable for momentum investors than growth investors.
Outlook
Estimates have been trending upward for the stock and the magnitude of these revisions looks promising. Notably, VRSK has a Zacks Rank #3 (Hold). We expect an in-line return from the stock in the next few months.
Verisk Analytics, Inc. (VRSK): Free Stock Analysis Report
Original post