
It has been about a month since the last earnings report for Republic Services, Inc. (NYSE:RSG) . Shares have added about 6.2% in that time frame.
Will the recent positive trend continue leading up to its next earnings release, or is RSG due for a pullback? Before we dive into how investors and analysts have reacted as of late, let's take a quick look at the most recent earnings report in order to get a better handle on the important drivers.
Recent Earnings
Republic Services, Inc reported strong first-quarter 2018 results with earnings and revenues surpassing the Zacks Consensus Estimate.
Earnings per share came in at 74 cents compared with 55 cents in the year-ago quarter. Earnings beat the Zacks Consensus Estimate by 5 cents. The bottom line grew on higher revenues and the U.S. tax reform that decreased the company’s effective tax rate to 23.5% in the reported quarter. Total first-quarter 2018 revenues of $2,427.5 million beat the Zacks Consensus Estimate of $2,404 million. The figure was up 1.5% year over year. Top-line growth includes a positive impact of 3.8% internal growth and 1.8% from acquisitions. All the segments recorded impressive performance in the reported quarter.
Internal growth was basically driven by 2.2% increase in average yield, 2% volume growth and increase in energy services revenues by 40 basis points. However, there was a negative impact of fuel recovery fees, which rose by 50 basis points. During the quarter, Republic Services invested $26 million for tuck-in acquisitions.
Revenues by Segment
Collection segment revenues were up 3% year over year to $1,823 million. It accounted for 75% of total revenues. Transfer and Disposal segment revenues improved 9.5% year over year to $119.7 million. It contributed 4.9% of total revenues. Landfill segment revenues increased 14.2% year over year to $306.5 million. It accounted for 12.6% of total revenues. Energy Services segment revenues increased 77.7% year over year to $47.8 million. Segment revenues were driven by an increase in drilling activity in the Permian Basin. It contributed 1.9% of total revenues. Other segment revenues increased 4.7% to $130.5 million. It accounted for 5.4% of total revenues.
Operating Results
Adjusted EBITDA was $699.4 million, up 7% from the prior-year quarter. Adjusted EBITDA margin of 28.8% marked an improvement of 140 basis points from the year-ago quarter. Operating income for first-quarter 2018 was $404.2 million compared with $388.1 million in the year-ago quarter. Operating margin was 16.7% compared with 16.2% in the year-ago quarter. Total selling, general and administrative expenses were $261.2 million compared with $253.5 million in the year-ago quarter.
Balance Sheet and Cash Flow
Republic Services exited first-quarter 2018 with cash and cash equivalents of $62.6 million compared with $83.3 million at the end of December 2017. As of Mar 31, 2018, long-term debt (net of current maturities) was $7,499.7 million compared with $7,480.7 million as of Dec 31, 2017. The company generated $581.4 million of cash from operating activities in the reported quarter compared with $444.4 million in the year-ago quarter. Adjusted free cash flow was $355.7 million in the reported quarter compared with $240.3 million in the year-ago quarter.
Share Repurchase and Dividend Payout
During the reported quarter, Republic Services returned $350 million to its shareholders through dividends and share repurchases. The company repurchased almost 3.5 million shares at an aggregate cost of $235.6 million and an average price of $66.55 per share. As of Mar 31, 2018, the company had $1.6 billion available under its share repurchase authorization.Additionally, on the same day of earnings release, the company’s board of directors announced a quarterly cash dividend of 34.5 cents per share, payable on Jul 16 to shareholders of record as of Jul 2.As of Mar 31, 2018, the company’s quarterly dividend payable was $113.3 million to shareholders of record on Apr 2. The dividend was paid on Apr 16. In January, the company paid a cash dividend of $114.4 million to shareholders of record as of Jan 2, 2018.
How Have Estimates Been Moving Since Then?
In the past month, investors have witnessed a downward trend in fresh estimates. There has been one revision higher for the current quarter compared to two lower.
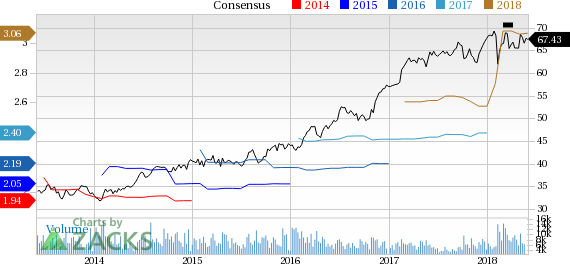
Republic Services, Inc. Price and Consensus
VGM Scores
At this time, RSG has a great Growth Score of A, though it is lagging a bit on the momentum front with a B. Charting a somewhat similar path, the stock was allocated a grade of C on the value side, putting it in the middle 20% for this investment strategy.
Overall, the stock has an aggregate VGM Score of A. If you aren't focused on one strategy, this score is the one you should be interested in.
Based on our scores, the stock is primarily suitable for growth investors while also being suitable for those looking for momentum and to a lesser degree value.
Outlook
Estimates have been broadly trending downward for the stock and the magnitude of these revisions has been net zero. It's no surprise RSG has a Zacks Rank #4 (Sell). We expect a below average return from the stock in the next few months.
Republic Services, Inc. (RSG): Free Stock Analysis Report
Original post
Zacks Investment Research