
A month has gone by since the last earnings report for Marsh & McLennan Companies, Inc. (NYSE:MMC) . Shares have lost about 1.5% in that time frame.
Will the recent negative trend continue leading up to its next earnings release, or is MMC due for a breakout? Before we dive into how investors and analysts have reacted of late, let's take a quick look at its most recent earnings report in order to get a better handle on the important drivers.
Marsh & McLennan Q1 Earnings Top Estimates, Up Y/Y
Marsh & McLennan reported first-quarter 2018 adjusted earnings per share of $1.38, beating the Zacks Consensus Estimate by 6.1%. Also, the bottom line improved 28% year over year.
In the quarter under review, Marsh & McLennan’s consolidated revenues were $4 billion, up 4% on an underlying basis. Moreover, the top line outpaced the Zacks Consensus Estimate by 4.3%.
Total operating expenses of $3,092 million in the first quarter were up 12.3% year over year.
Quarterly Segment Results
Risk and Insurance Services
Revenues at the Risk and Insurance Services segment were $2.3 billion, up 3% on an underlying basis. Adjusted operating income also grew 30% to $723 million from the prior-year quarter.
Marsh, a unit within this segment, generated revenues of $1.7 billion, up 2% on an underlying basis. In U.S./Canada, underlying revenues rose 3%. Underlying revenue growth remained flat from international operations, reflecting underlying growth of 4% in Asia Pacific and 6% in Latin America. This was partially offset by a decline of 2% in EMEA.
Another unit under this segment — Guy Carpenter — displayed revenue growth of 7% on an underlying basis to $637 million.
Consulting
The Consulting segment's revenues increased 5% on an underlying basis to $1.7 billion. Additionally, adjusted operating income increased 8% year over year to $248 million.
A unit within this segment — Mercer — reported revenues of $1.2 billion, up 5% on an underlying basis. Wealth with revenues of $565 million, grew 3% on an underlying basis.
Another unit, Oliver Wyman Group, posted revenues of $497 million, up 6% on an underlying basis.
Financial Update
Marsh & McLennan exited the quarter with cash and cash equivalents of $1,168 million, down 3% from 2017 end.
As of Mar 31, 2018, Marsh & McLennan’s total assets were $21,379 million, up 4.6% from year-end 2017.
Total equity was $8,021 million, up 7.8% from year-end 2017.
Capital Deployment
The company repurchased 3 million shares of its common stock for $250 million in the first quarter.
How Have Estimates Been Moving Since Then?
In the past month, investors have witnessed a downward trend in fresh estimate. There have been seven revisions lower for the current quarter.
Marsh & McLennan Companies, Inc. Price and Consensus
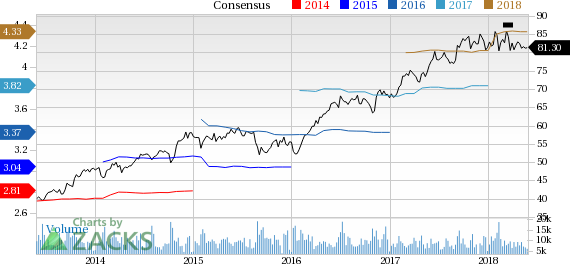
Marsh & McLennan Companies, Inc. Price and Consensus | Marsh & McLennan Companies, Inc. Quote
VGM Scores
At this time, MMC has a subpar Growth Score of D, a grade with the same score on the momentum front. Following the exact same course, the stock was allocated a grade of D on the value side, putting it in the bottom 40% for this investment strategy.
Overall, the stock has an aggregate VGM Score of F. If you aren't focused on one strategy, this score is the one you should be interested in.
Our style scores indicate investors will probably be better served looking elsewhere.
Outlook
Estimates have been broadly trending downward for the stock and the magnitude of these revisions indicates a downward shift. Notably, MMC has a Zacks Rank #3 (Hold). We expect an in-line return from the stock in the next few months.
Marsh & McLennan Companies, Inc. (MMC): Free Stock Analysis Report
Original post
Zacks Investment Research