
About a month has gone by since the last earnings report for Hess Corporation (NYSE:HES) . Shares have lost about 11.9% in that time frame, underperforming the market.
Will the recent negative trend continue leading up to the stock's next earnings release, or is it due for a breakout? Before we dive into how investors and analysts have reacted of late, let's take a quick look at the most recent earnings report in order to get a better handle on the important drivers.
Second-Quarter 2017 Results
Hess reported adjusted second-quarter 2017 loss from continuing operations of $1.46 per share, which is wider than the Zacks Consensus Estimate of a loss of $1.32. The reported figure was substantially wider that the loss of $1.29 in the year-ago quarter attributed to the plunge in gas prices.
Revenues plunged more than 3% year over year to $1,228 million from $1,269 million. However, the top line surpassed the Zacks Consensus Estimate of $1,192 million.
Second-Quarter Operational Performance
In the reported quarter, the company’s Exploration and Production (E&P) business incurred adjusted loss of $354 million, narrower than the year-earlier loss of $328 million.
Quarterly hydrocarbon production totaled 300 thousand barrels of oil equivalent per day (MBOE/d), down 4.2% year over year.
Crude oil production was 177 thousand barrels per day compared with 179 thousand barrels per day in the year-ago quarter. Natural gas liquids production totaled 42 thousand barrels against 44 thousand barrels a year ago. Natural gas output was 487 thousand cubic feet (Mcf) compared with 539 Mcf in the prior-year quarter.
Worldwide crude oil realization per barrel of $45.95 (including the impact of hedging) increased 9.5% year over year. Worldwide natural gas prices plummeted 10.9% year over year to $3.19 per Mcf.
Financials
Quarterly net cash flow from operations was $165 million at the end of the quarter. Hess’ capital expenditures increased 9.1% to $528 million from $484 million in the prior-year quarter.
As of Jun 30, the company had approximately $2,492 million in cash and $6,612 million in long-term debt. The debt-to-capitalization ratio at the end of the quarter was 30.2%.
How Have Estimates Been Moving Since Then?
Analysts were quiet during the last month as none of them issued any earnings estimate revisions.
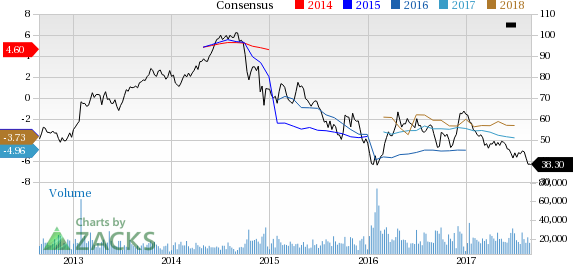
Hess Corporation Price and Consensus
VGM Scores
At this time, Hess' stock has a subpar Growth Score of D. However, its Momentum is doing a lot better with a B. The stock was allocated a grade of F on the value side, putting it in the fifth quintile for this investment strategy.
Overall, the stock has an aggregate VGM Score of F. If you aren't focused on one strategy, this score is the one you should be interested in.
The company's stock is suitable solely for momentum investors based on our style scores.
Outlook
The stock has a Zacks Rank #4 (Sell). We expect below average returns from the stock in the next few months.
Hess Corporation (HES): Free Stock Analysis Report
Original post
Zacks Investment Research