
It has been about a month since the last earnings report for DTE Energy Company (NYSE:DTE) . Shares have lost about 2.5% in that time frame.
Will the recent negative trend continue leading up to its next earnings release, or is DTE due for a breakout? Before we dive into how investors and analysts have reacted as of late, let's take a quick look at its most recent earnings report in order to get a better handle on the important catalysts.
DTE Energy Beats on Q1 Earnings, Reaffirms '18 View
DTE Energy reported first-quarter 2018 operating earnings per share of $1.91, which beat the Zacks Consensus Estimate of $1.89 by 1.06%. Operating earnings improved 6.7% from the year-ago quarter’s figure of $1.79.
On a GAAP basis, reported earnings came in at $2.00 per share compared with $2.23 in the prior-year quarter.
Highlights of the Release
During the quarter, the company submitted a plan to double its renewable energy capacity by early 2020 to the Michigan Public Service Commission.
During the quarter, the company lowered natural gas prices for its customers in March and again in April, resulting in a drop of 20% from the year-ago period.
Net income in the reported quarter was $342 million compared with $322 million in the year-ago quarter.
Segmental Details
Utility Operations
DTE Electric: The segment’s operating earnings were $142 million, up from $106 million in the prior-year quarter.
DTE Gas: The segment incurred operating earnings of $111 million compared with $107 million in the prior-year quarter.
Non-Utility Operations: The operating earnings from Non-Utility operations were $105 million compared with $93 million in the prior-year quarter.
Guidance
The company reaffirmed its 2018 operating earnings per share guidance in the range of $5.57-$5.99.
How Have Estimates Been Moving Since Then?
In the past month, investors have witnessed a downward trend in fresh estimates. There has been one revision lower for the current quarter.
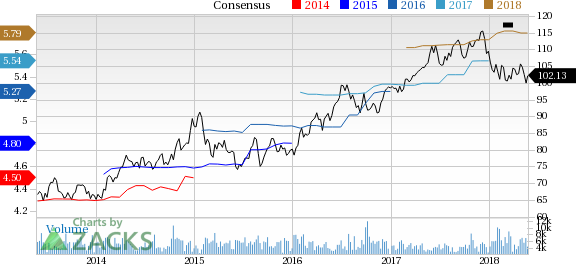
DTE Energy Company Price and Consensus
VGM Scores
At this time, DTE has an average Growth Score of C, however its Momentum is doing a bit better with a B. Charting a somewhat similar path, the stock was allocated a grade of C on the value side, putting it in the middle 20% for this investment strategy.
Overall, the stock has an aggregate VGM Score of B. If you aren't focused on one strategy, this score is the one you should be interested in.
Based on our scores, the stock is more suitable for momentum investors than those looking for value and growth.
Outlook
Estimates have been broadly trending downward for the stock and the magnitude of this revision indicates a downward shift. It's no surprise DTE has a Zacks Rank #4 (Sell). We expect a below average return from the stock in the next few months.
DTE Energy Company (DTE): Free Stock Analysis Report
Original post
Zacks Investment Research