
It has been about a month since the last earnings report for CMS Energy Corporation (NYSE:CMS) . Shares have added about 4.8% in that time frame, outperforming the market.
Will the recent positive trend continue leading up to the stock's next earnings release, or is it due for a pullback? Before we dive into how investors and analysts have reacted of late, let's take a quick look at the most recent earnings report in order to get a better handle on the important drivers.
CMS Energy Tops Q1 Earnings Estimates, Keeps '17 View
CMS Energy reported first-quarter 2017 adjusted earnings per share of $0.71, beating the Zacks Consensus Estimate of $0.65 by 9.2%. Quarterly earnings also improved 20.3% from the year-ago figure of $0.59.
Operational Performance
In the quarter under review, CMS Energy’s operating revenues came in at $1,829 million, beating the Zacks Consensus Estimate of $1,820 million by nearly 0.5%. On a year-over-year basis too, revenues improved 1.6% from $1,801 million.
The company’s operating expenses dropped 2.3% to $1,441 million during the quarter.
Operating income during the first quarter was $388 million, up 19% from $326 million a year ago.
CMS Energy’s interest charges were $107 million, up merely 0.9% from $106 million in the year-ago period.
Financial Condition
CMS Energy had cash and cash equivalents of $433 million as of Mar 31, 2017, up from $235 million as of Dec 31, 2016.
As of Mar 31, 2017, total debt, capital leases and financing obligations stood at $9,717 million, up from $9,706 million as of Dec 31, 2016.
At the end of the first quarter, cash from operating activities was $646 million compared with $632 million in the year-ago period.
Guidance
CMS Energy reaffirmed its 2017 adjusted earnings per share guidance in the range of $2.14–$2.18. Adjusted earnings are still expected to grow year over year in the range of 6–8% in 2017.
How Have Estimates Been Moving Since Then?
Analysts were quiet during the last one month period as none of them issued any earnings estimate revisions.
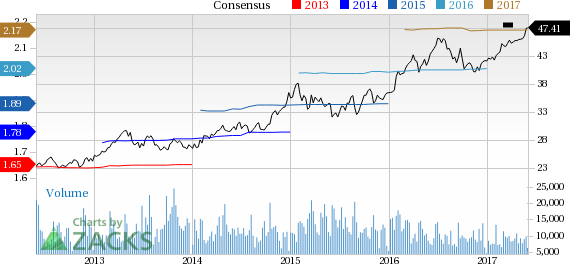
CMS Energy Corporation Price and Consensus
VGM Scores
At this time, CMS Energy's stock has a nice Growth Score of 'B', a grade with the same score on the momentum front. The stock was allocated a grade of 'C' on the value side, putting it in the middle 20% for this investment strategy.
Overall, the stock has an aggregate VGM Score of 'B'. If you aren't focused on one strategy, this score is the one you should be interested in.
Based on our scores, the stock is more suitable for growth and momentum investors than those looking for value.
Outlook
Notably, the stock has a Zacks Rank #3 (Hold). We expect in-line returns from the stock in the next few months.
CMS Energy Corporation (CMS): Free Stock Analysis Report
Original post
Zacks Investment Research